Since March 2024, the cryptocurrency market has seen a correction, with altcoins down >50% from peak. While the state of liquid tokens is obvious, the impact is less clear for private deals and token launches. By looking at over 2,000 deals across traditional and token sales, we found that early-stage activity and ticket sizes ($M) remain stable, token launches respond to market movement (1st derivative) rather than the absolute level and we see sustained accelerator activity.
Author: Jasper De Maere | X | Linkedin
Bottom Line
- Within Web3 private markets, early stage (pre seed/seed) venture ticket size ($M) and deal pace (#) is holding up relative to a later stage (A+) that is seeing some slow down and less capital ($M) deployed.
- Public and private tokens sales activity reacts with one month lag to the first derivative of the broader crypto market leading to a surge of activity, followed by a month of cooldown as observed in January and April this year.
- This year has been dominated by public token sales, accounting for 81% of all launches YTD. No single vertical has seen more private than public sales, indicating a strong preference for public listings, likely driven by a supportive market environment.
- The post-money valuation data across different stages is too inconsistent to yield meaningful insights, as decisions on disclosure often carry biases or underlying agendas.
Ticket Sizes & Vertical Maturity
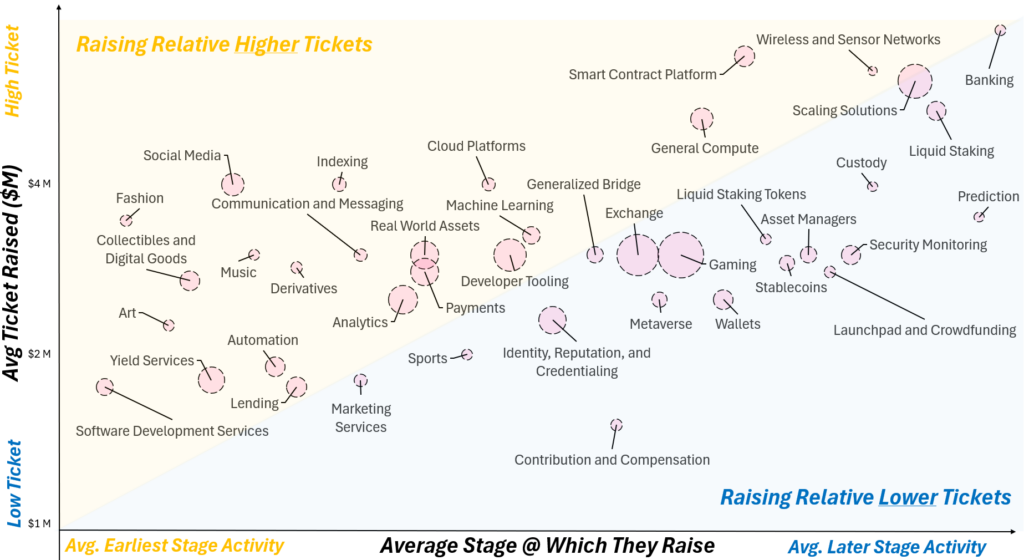
Web3 itself is not an industry but rather a technology stack which is revolutionizing different industries. As a result, no two verticals in web3 are the same. This is further influenced by the founder’s backgrounds and the design of novel business models required to incentivize sustained participation. Accordingly, all web3 verticals have different capital requirements. By combining the ticket size ($M) with the stage in which the verticals mainly raise, we get a proxy (avg. capital raised/ avg. vertical maturity).
In Exhibit 1, we look at:
- X-Axis – Where on average we see most activity in each vertical as a proxy of the relative maturity of that vertical.
- Y-Axis – The average capital raised in the rounds for each vertical.
- Bubble Size – The number of deals done YTD (‘24)
→ Blue marks relatively capital light verticals while yellow is more capital intensive.
Exhibit 1: Average Stage & Ticket Size Raised Per Vertical In ‘24 YTD
Source: Outlier Ventures, Messari
Token Raises
We looked at 375 unique projects that either did a public- private or combined token sale YTD (11 Aug ‘24).
Key takeaways:
- Token raises move in line with the direction of the liquid market, not the absolute level. As a result we’ve seen a slowdown as the market is trading in a range.
- Token launches in general react with one month lag to strong +ve market moves followed by a weaker month, indicating that timing is still #1 metric.
- ~81% of all token sales are public and there is no vertical that has had more private than public sales so far in 2024.
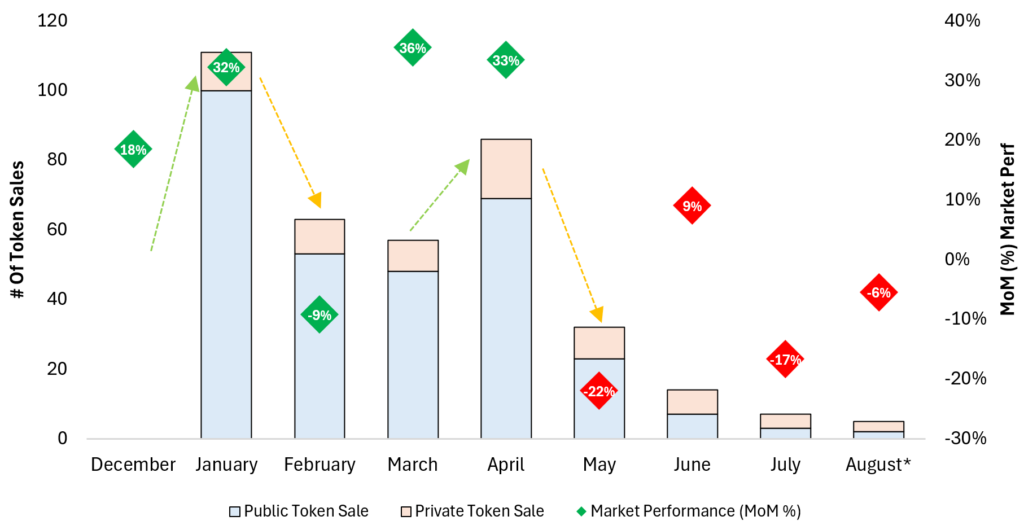
Looking at 375 private (70) and public (305) token launches over the past year, we see the clear movement of activity according to monthly change of the altcoin market cap. Generally when the market is on a tear, the number of token launches go up dramatically the month after. The combination of the holidays with the market trading in range has led to muted activity over the past few months.
Exhibit 2: # of public and private token launches vs % MoM of the Altcoin Marketcap
Source: Outlier Ventures, Messari
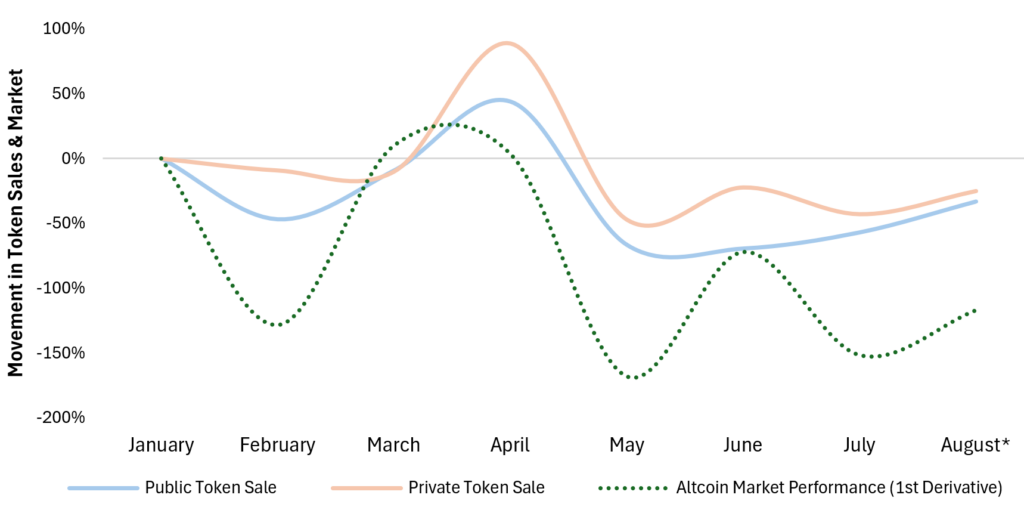
Looking closer at the relative movement of the amount of token launches vs the first derivative of monthly performance we see evidence that the number of token launches moves on the directional relative movement of the market rather than the absolute. We observe that private launches exhibit more volatility. We believe this is expected, as public launches typically require more preparation, which can cause them to miss the optimal opportunity window.
Exhibit 3: Relative performance of token launches vs first derivative of the Altcoin Marketcap
Source: Outlier Ventures, Messari
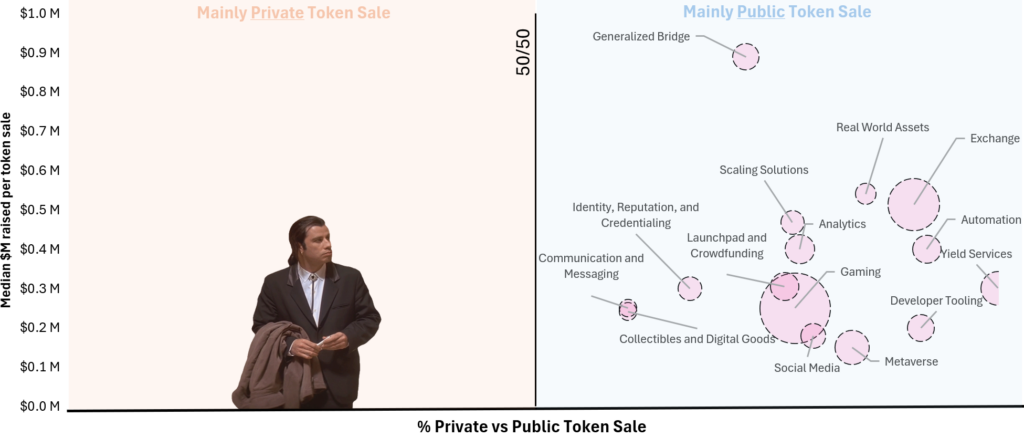
Finally we take a closer look at the type of token sales conducted. ~81% of all sales are public and so far there is no vertical that has conducted more private than public sales this year. Below you see on the X-axis the public/private metric, the Y-axis shows the median capital raised through the sales and the bubble size indicates the number of token sales done. Gaming (82), Exchanges (44), Yield Services (19) and Metaverse (19) conducted most token sales YTD.
Exhibit 4: Relative share of public vs private token launches & median ($M) capital raised
Source: Outlier Ventures, Messari
Traditional Venture
We looked at 1919 different traditional deals YTD (11 Aug ‘24) across various stages.
Key Takeaways:
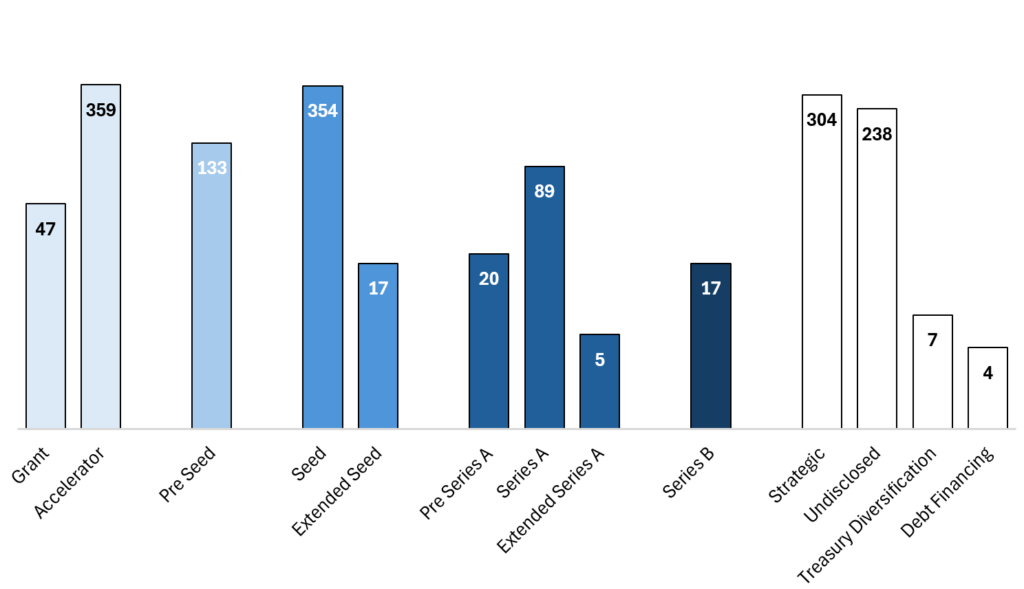
- Seed remains the most active stage followed by accelerator and pre seed stages. The difference between pre seed and seed is fading as token sales come into the mix.
- Number of accelerator deals YTD is high as more ecosystems and others are popping up as the cycle heats up.
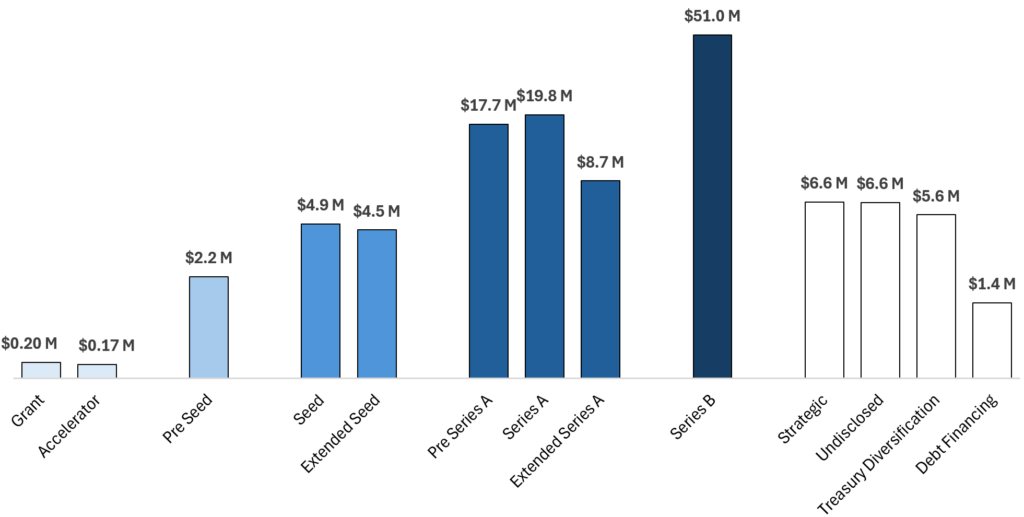
- We’ve seen these average ticket sizes across Pre Seed ($2.2M), Seed ($4.9M), Series A ($19.8M) and Series B ($51M) so far in 2024.
Below a closer look at the numbers. We see that Seed is where most activity happens followed by Pre Seed. Anecdotally we see increasingly fewer companies making the distinction between both as sometimes Pre Seed gets substituted by private token sales. Next, we note a lot of accelerator deal activity which from our observations must be up quite a bit YoY as we see a number of new ecosystem accelerators popping up. A number which is clearly off is the number of grants. I think the real number is an order of magnitude larger than displayed. Often grants are not perceived as true deals.
Exhibit 5: Number of deals YTD across different stages (excl. Token Sales)
Source: Outlier Ventures, Messari
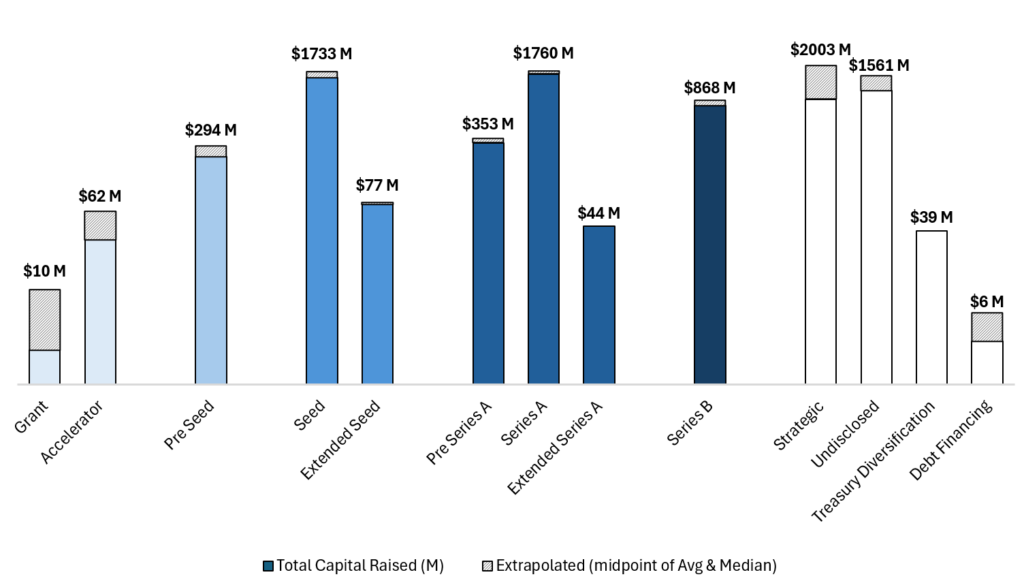
Looking at the $M raised we get the exhibit below. It’s relatively common that stages don’t disclose the amount raised. If the data sample is large enough, which I believe is the case here, there’s a way to extrapolate the numbers. As shown below, the gray area is the added extrapolation based on the % missing data points. A conservative approach to eliminate the outsized impact of anomalies, a blend between median & average was added to get to the total number. As mentioned before, the Grant $M is off.
Exhibit 6: Total Capital Raised ($M) Across Different Stages (Adjusted)
Source: Outlier Ventures, Messari
Taking it one step further using the two exhibits above, we calculate an approximation for the average ticket size across stages YTD we take the total extrapolated $M raised divided by the total number of registered deals. While not an exact science, it gives us a good estimation which sits in line with what we’ve been empirically hearing in the market and are advising our cohorts.
Exhibit 7: Average Ticket Size ($M) Per Deal Stage
Source: Outlier Ventures, Messari
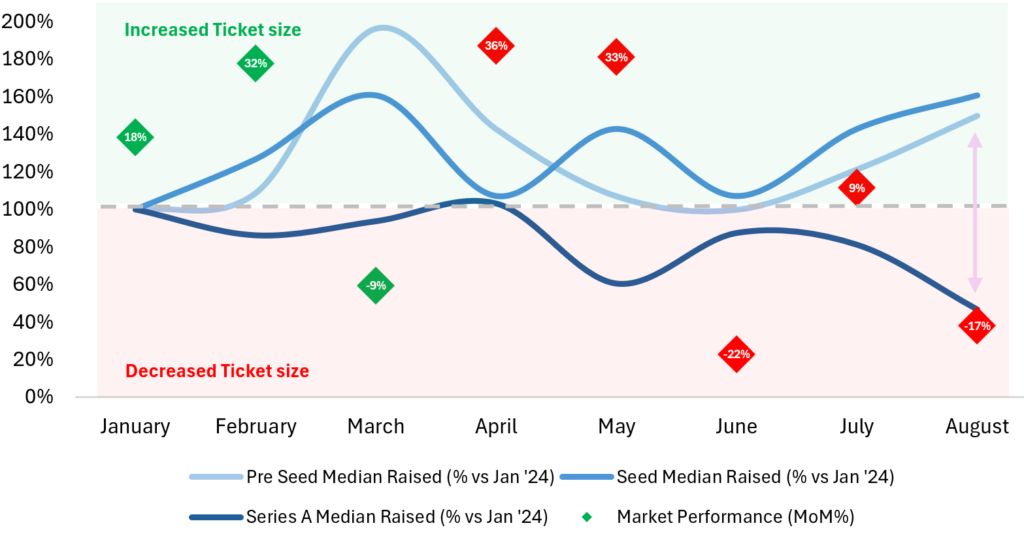
Finally, we examine ticket sizes over time across the three key stages: pre-seed, seed, and Series A. Key observation – earlier-stage ticket sizes have remained more resilient despite some market turmoil. Generally early-stage ventures are less affected by market conditions as they revolve around ideation. In contrast, Series A, which are closer to or at a token generation event (TGE), require evidence of traction. Market pullbacks typically hit later-stage investments harder, reducing both activity and ticket size, as seen in 2022. The recent increase in early-stage ticket sizes (since Jan ‘24) could be driven by investors shifting from later to earlier stages during market turmoil, making these rounds more competitive. Similar to token launches, we see ticket sizes slightly lagging market activity, this has simply to do with the time it takes to close and report the deal, which adds a few weeks to the process.
Exhibit 8: Change In Ticket Size (%) Across Stages vs January ‘24 Size
Source: Outlier Ventures, Messari
Data Adjustment
Key Takeaways:
- Token sales often are combined with other types of funding such as seed, series A and strategic rounds.
- The most frequent combination of stages in a short period of time is accelerators and seed. A common combination as many raise at or right after joining a program.
If you made it all the way down here, congratulations. For the exercise above we took line by line reporting of all deals YTD. Due to the way crypto ventures typically structure deals, there are natural duplications of data. We shed some more light on this.
In our data we have 1392 unique companies that registered one or more deals across traditional or token sales. A few of them were simple duplications which have been removed at the start. Most have multiple stages/or deals for one of the following two reasons:
- The company conducted multiple stages YTD.
- The company executed traditional VC alongside a token sale.
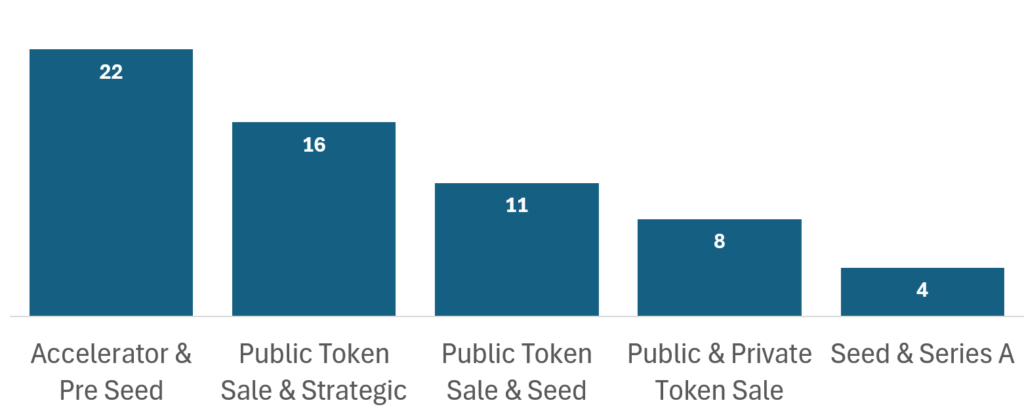
Below are some of the most common funding combinations. The most frequent is accelerator and seed, which makes sense as accelerators help de-risk the business model, and companies typically join accelerators when raising pre-seeds or seeds. We’re also seeing public token sales coinciding with strategic or seed rounds, often timed with Token Generation Events (TGEs) just before or at launch. Additionally, only four companies have rapidly progressed through funding stages, closing both seed and Series A rounds this year.
Exhibit 9: Combinations of funding options across data set
Source: Outlier Ventures, Messari
We highlight these trends to reassure founders that unconventional funding structures are not unusual. The option to choose between traditional equity and tokens offers valuable flexibility, which we encourage founders to take advantage of.