Part II: Native Token Flows
Introduction
In the first part of the uncollateralized lending protocol dissection series, a recap on the general sector protocol approach as well as comparisons on relevant market data of leading providers have been carried out. The more detailed on-chain analyses in this second part will reveal some key insights on the native protocol token flows to bring light to the following aspects
- Token price performance
- Token holder growth rates
- Token flows of aggregated stakeholders
- Token holding behavior
- Key ecosystem address receiver behavior
The motivation to have a deeper look into the decentralized uncollateralized lending sector originates from the underrepresented market share with respect to the overall DeFi and crypto market, considering the high relevance of uncollateralized lending in traditional finance.
Methodology and Limitations
Blockchain data is publicly available to everyone, especially through blockchain explorers like etherscan.io, bscscan.com, snowtrace.com, polygonscan.com, arbiscan.io, etc. Nevertheless, it is not accessible for in-depth analyses for non-tech people that are not familiar with using blockchain explorers or other third party APIs. Therefore some companies specialized on providing those more sophisticated insights to the blockchain data for people without programming background through predefined or semi-customizable dashboards, such as nansen.ai, defiLlama.com, messari.io, tokenterminal.com, artemis.xyz, etc.. DUNE analytics also provides many dashboards, but as soon as the user requires a custom dashboard for their own queries, a basic database programming knowledge is required. Sanity and source checks are crucial when using these third party databases, since many involve manual contract identification and decoding.
The on-chain analyses in this report are focused on the 3 protocols Maple, TrueFi, and Goldfinch on the Ethereum blockchain due to the limited scope of this work. The on-chain analyses have been performed by leveraging the Etherscan API, Moralis API, and TheGraph with Python scripts. The algorithm is built to scrape all ERC-20 transactions that have ever occurred with the corresponding native token of the protocol. To bring meaning to the anonymous addresses involved in the transactions, an internal address identification database has been created. It contains all identified addresses and serves additionally as a categorization catalog of transaction participants. Each relevant address is categorized in terms of “ID”, “Owner”, “Category”, and “Function”. The procedure for address identification has been carried out as follows:
- The scraping algorithm creates analyses from all the transactions scraped for one ERC-20 native protocol token. At this point all involved addresses are known but unidentified.
- The most relevant addresses from these analyses are added to the internal database for the identification process. Note that the term “most relevant” refers to the leading and most dominant addresses occurring in the different analyses categories.
- Extracting more relevant addresses and their corresponding identification from existing DUNE dashboards and from Token Terminal dashboard sources.
- Adding all addresses from relevant exchanges into the identification database as listed on Etherscan.
- This procedure results in around 100 “relevant” addresses per ecosystem that have to be identified through a manual process:
- Searching for the address via the etherscan.io web frontend and looking for address labels and tags, connected ens domains, contract names (in cases of a contract), high level transaction behavior in general and just with the ecosystem token.
- Leveraging the nansen.ai database for a cross check for confirmation or as a single source for the address identification, where no information could be gathered from other sources.
- Repeating the ecosystem analyses with all identified addresses to create the resulting analyses graphs.
The self developed Python algorithm is capable of aggregating identified/categorized addresses to predefined groups and handling those as one representative stakeholder, where needed. These analyzes are focussed on token flows rather than decoding of blockchain events/topics, associated with the token to limit the depth and scope of this study. Instead this study focuses on the token receiving and sending behavior, including in-depth token issuer receiver network analyses.
Note that the aggregated stakeholder balances may show some transient peaks on their curves. These are caused by internal transfers from one stakeholder address to another address of the same stakeholder group. This results in a net zero sum peak.
The identification process involved the manual dissection of around 300 relevant addresses. Even though the above described process has been carried out with the best of knowledge and belief, it is possible that some addresses have been identified or categorized incorrectly.
The complete set of plots generated by the analyzes are located in this GoogleDrive folder for reference. Hence, the attached charts in this document are only of exemplary nature due to the pure amount of data and should rather serve as illustration for most relevant results.
Key Insight Aggregation
– Maple Finance
Data Scraping date: 30.05.2023
Total Supply: 10,000,000 $MPL
Price
 |
| Figure 1: $MPL price chart |
- Strong price appreciation despite the bear market in Apr 22
- Price depreciated around 95% from the peak of April 22 to current time. Wintermute hack and Alameda fallout were significant contributors to this depreciation, along with an overall market downturn
Wallets
 |
| Figure 2: Ever interacted wallets and holder counts for $MPL |
- Holder count 3 days after DEX liquidity deployment: 1.25k
- Holders are all addresses that hold the token on the respective date on the timeseries.
- Ever interacted addresses and holders continuously grow.
- The term “ever interacted” refers to the cumulative sum of unique wallets that ever interacted with the native token on the respective date on the timeseries.
- Avg. ever interacted addresses growth: 18 addresses / day
- Avg. holder growth: 6.8 addresses / day
- Most growth at the beginning and during the second top of the last bull cycle
Token Flows of Aggregated Groups
 |
| Figure 3: Token flows of aggregated groups for $MPL |
- VCs became more active (sending & receiving tokens) from the middle of 2022 until Q1 2023.
- Maple native addresses own less and less of their own tokens, hence the holder distribution increased (in line with holder growth).
- After xMPL staking pool launch (middle of 2022), around 23% of the total supply got sent to it – currently holding 19% of the total $MPL supply.
- The treasury holds 19% of the total $MPL supply.
- CEX and DEX holdings are in a low one digit percent range of around 3% together.
- These aggregated insights are confirmed by the equivalent Nansen token distribution analyses in Appendix A.1.
Leaderboards
 | ||
| Figure 4: $MPL transaction count, volume, and balance wallet leaderboards |
- DEXs and MEV bot 2 have the highest tx counts and token volume in the $MPL ecosystem.
- Largest token balances are held by xMPL Staking pool (19%) and MPL Treasury 1 (15.6%), which is in line with etherscan holder rankings.
Token Holding behavior
 |
| Figure 5: Sum of ever sent token amounts from different senders and the current holdings of the respective receivers for the $MPL ecosystem |
- In general: The token receivers from Maple native addresses hold less tokens than they once received from them.
- The term “native addresses” refers to all addresses that have been identified as owned by or related to the protocol. This also includes all team identified addresses.
- Receivers of the xMPL Staking pool still hold around 10% compared to the once received token amounts.
- Receivers of the Sablier v1.0.0 vesting contract only hold around 5% of the once received tokens.
Key Token Issuer Network Analyses
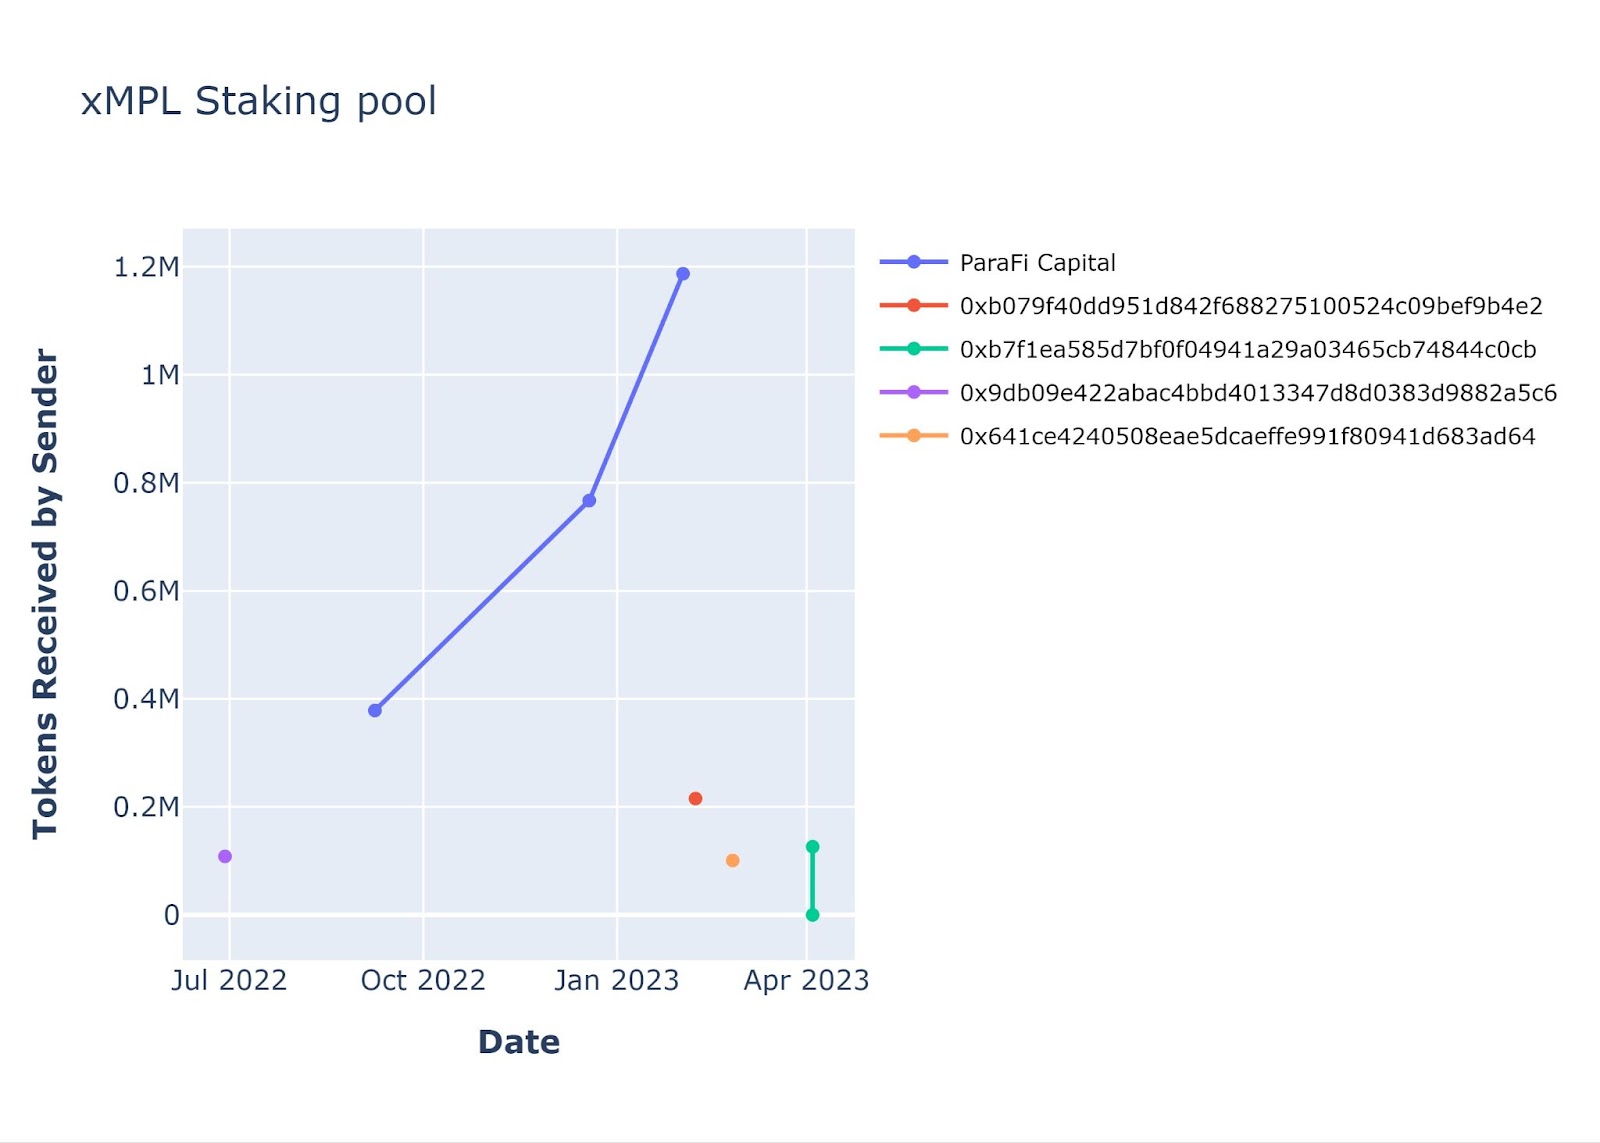 | 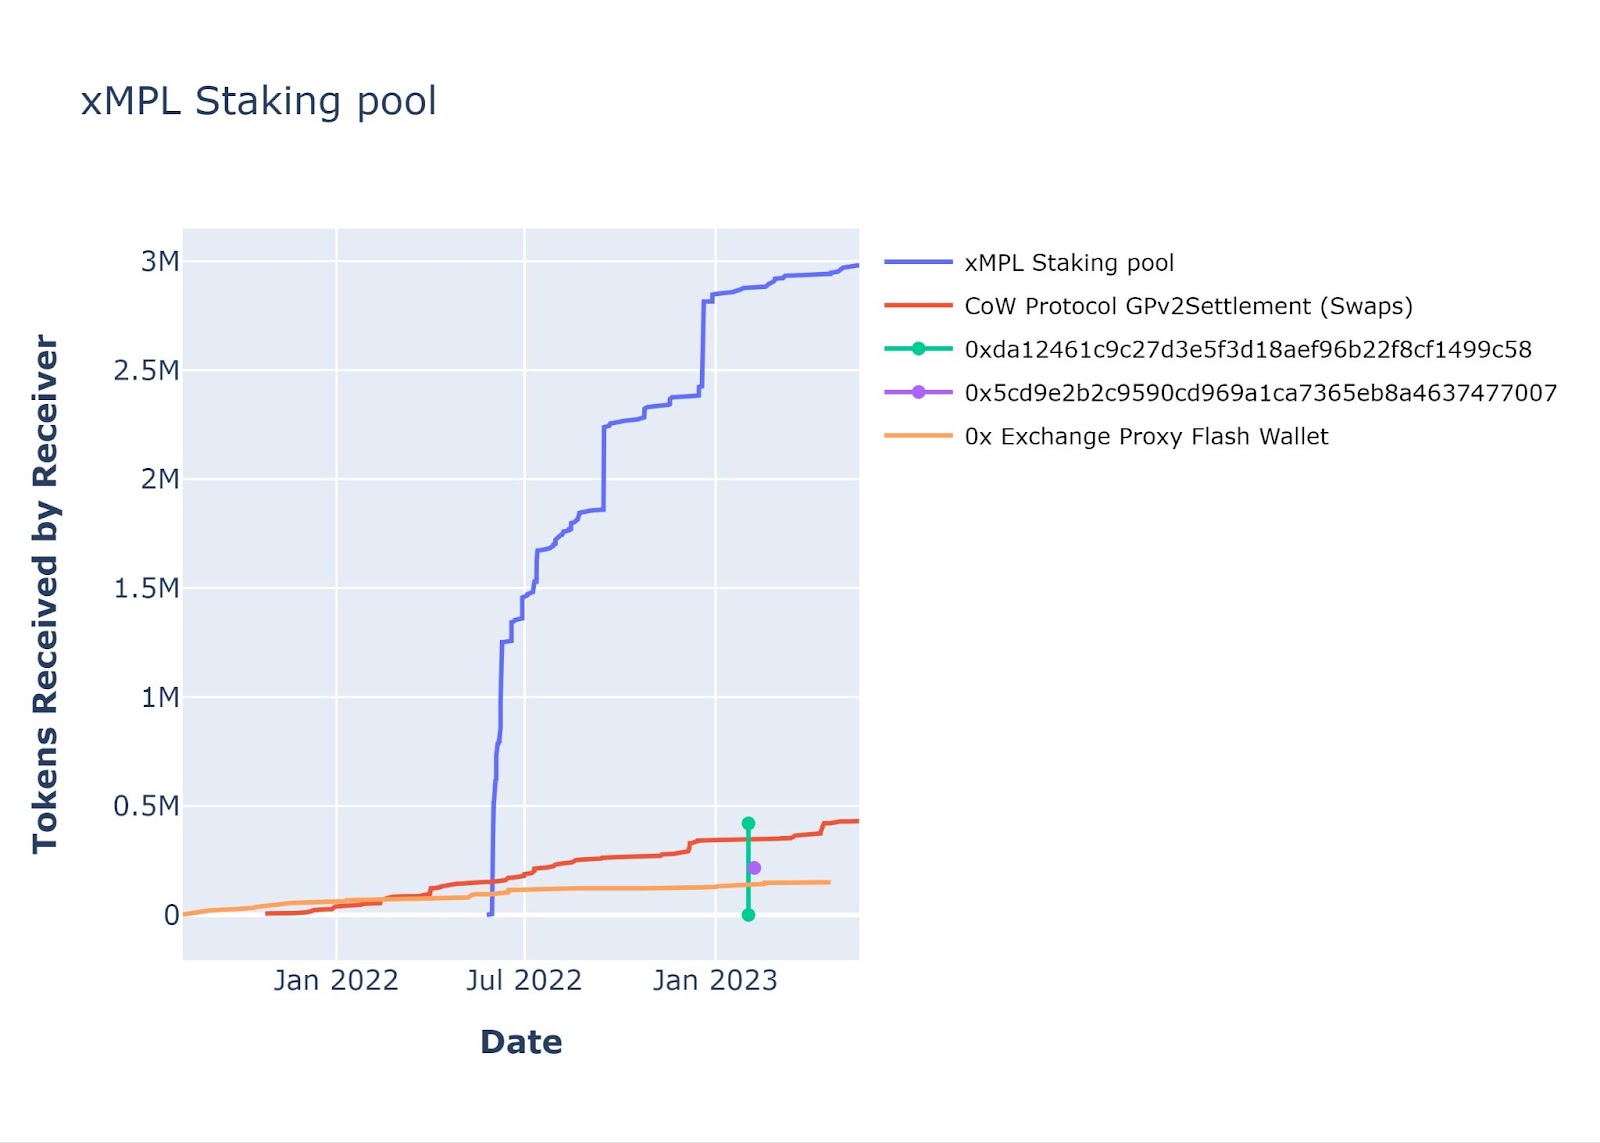 |
 |  |
| Figure 6: Historic $MPL receiver network analyses for the xMPL Staking pool and Sablier v1.0.0 – Vesting Contract Left: The historic cumulative token amounts once received from the sender for the top 5 receivers Right: The historic cumulative token sums of the top 5 receivers of all receivers | |
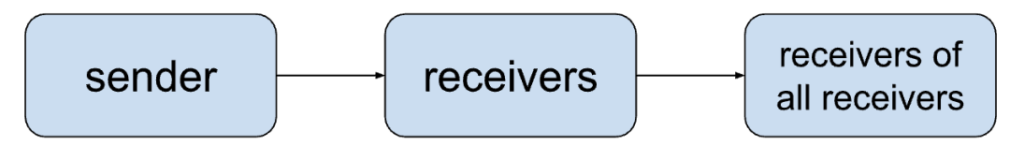 |
| Figure 7: Illustration of the different stages of token flows in this key token issuer network analysis. Note that the original sender could be among the receivers of all receivers. |
- Main receiver by the xMPL contract is ParaFi Capital
- The $MPL token flow from xMPL contract receivers goes mainly into the xMPL contract and follows a logistic function shape with a lot of adoption at the beginning where the contract was launched and less deposit volume at the end
- The second highest token receiver by the xMPL token receivers is a DEX
- Major Sablier v1.0.0 – Vesting Contract receivers are unknown apart from Framework Ventures
- Sablier v1.0.0 – Vesting Contract receivers sent most of their tokens to exchanges. Around half of their held supply got sent to the xMPL staking contract as it got deployed – see the VC token balance on Fig.6 as reference
– TrueFi
Data Scraping date: 30.05.2023
Total Supply: 1,198,450,773 $TRU tokens
Address Identification Remarks
In the case of TrueFi, 9 wallet addresses have been identified to be counted as TrueFi Treasury wallets based on their transaction behavior, even though their real ownership and purpose couldn’t be confirmed with certainty through the address identification procedure.
Price
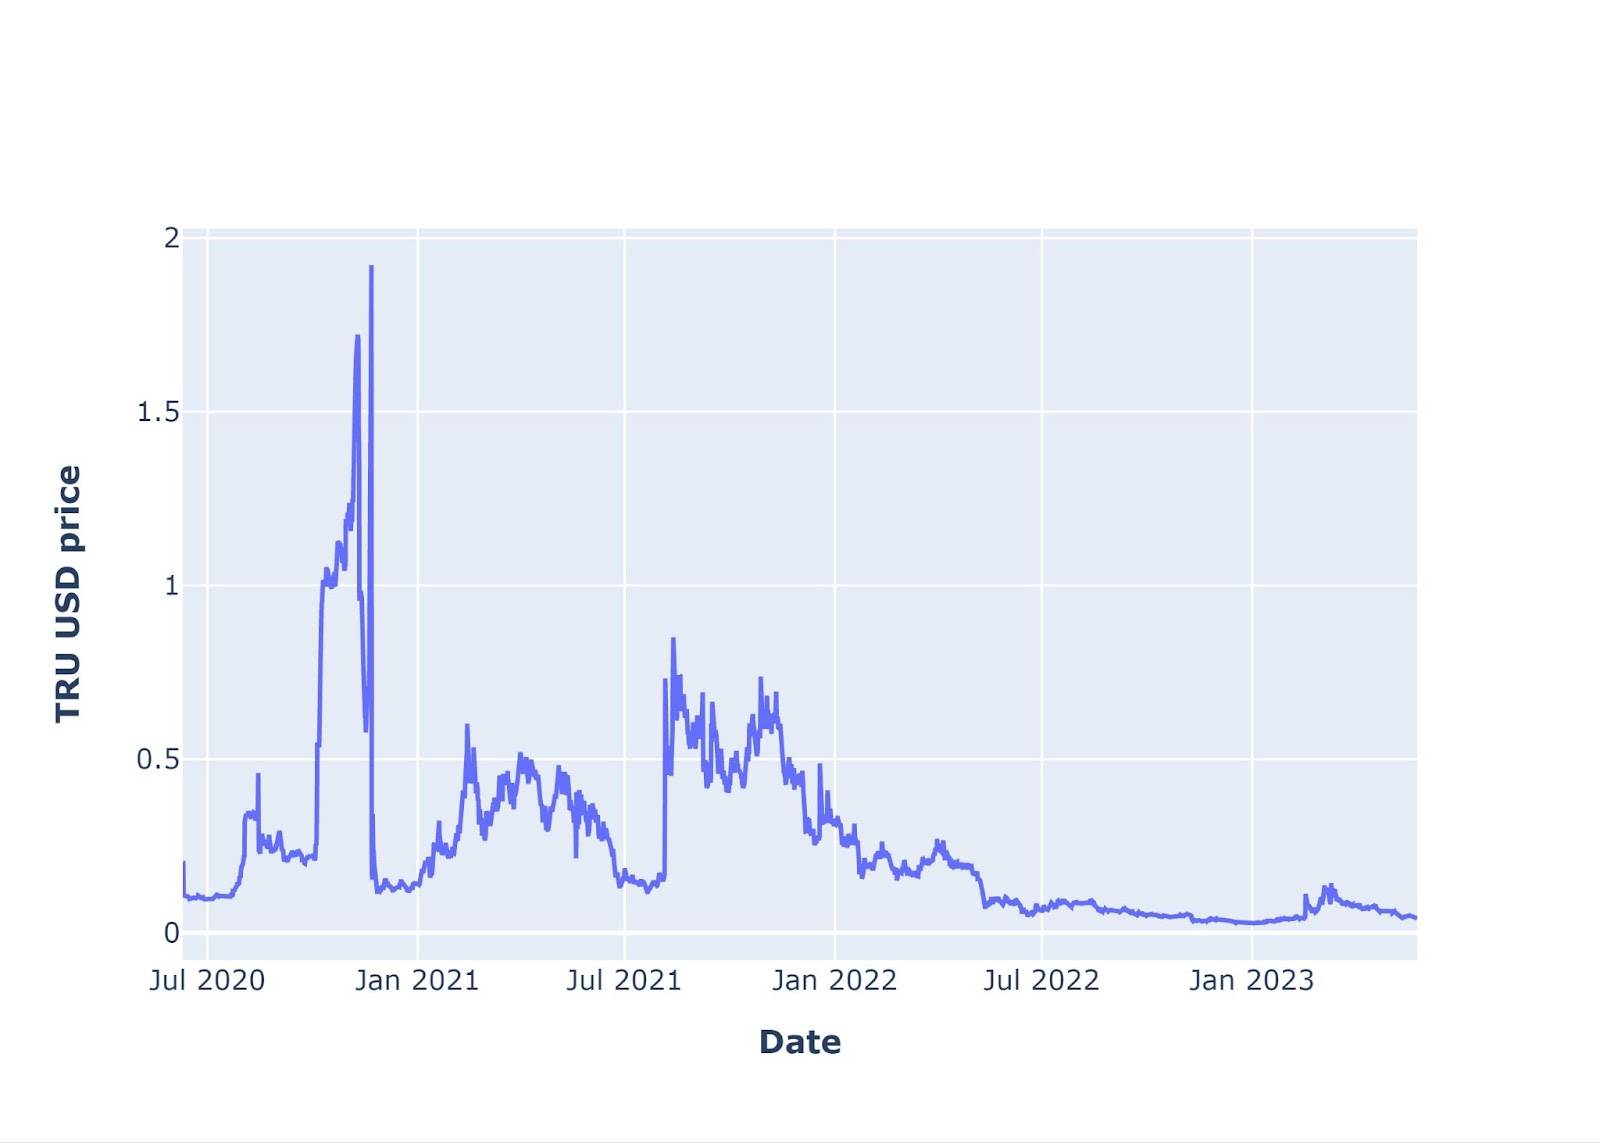 |
| Figure 8: $TRU price chart |
- In general the price shape is in line with the overall crypto market trend
- Price depreciation of around 95 % from the $TRU all-time-high (ATH)
Wallets
 |
| Figure 9: Ever interacted wallets and holder counts for $TRU |
- Holder count 3 days after DEX liquidity deployment: 2k
- Ever interacted addresses and holders continuously grow
- Avg. ever interacted addresses growth: 26 addresses / day
- Avg. holder growth: 8.1 addresses / day
- Most growth at the beginning and during the last bull cycle
Token Flows of Aggregated Groups
 |
| Figure 10: Token flows of aggregated groups for $TRU |
- CEX balances of the $TRU token increased continuously. Currently sitting at around 29% of the total supply.
- Token balances of all aggregated TrueFi addresses decreased continuously with a big spike down at the end of 2022, while their treasury wallets increased their holdings. It is possible that those tokens have been moved to another TrueFi native address that couldn’t be identified in the scope of this analysis
- The staking contract balance increased continuously until the end of October, but decreased from there. This is around the time where the FTX scandal happened. The staking contract currently holds 10% of the total supply
- The treasury holds 9% of the total supply
- DEXs only hold a small share of <1% of the total supply
- VCs don’t hold anymore tokens after they got vested
- These aggregated insights are confirmed by the equivalent Nansen token distribution analyses in Appendix A.2.
Leaderboards
 | ||
| Figure 11: $TRU transaction count, volume, and balance wallet leaderboards |
- By far the most transactions happened with the Uniswap v2 TRU-WETH and the SushiSwap TRU-WETH LPs.
- TrueFi stkTRU takes the third and MEV Bot 7 the 4th place in token transaction counts.
- Main token volume happens with TrueFi native addresses and exchanges. Note that the token volume on the respective CEXs is not represented here (this is the same for the other protocols).
- Main holders are TrueFi native addresses, CEXs, an unidentified “withdrawer after the FTX freeze”. In January 2023 BlockTower Capital and Justin Sun were also among the top holders.
Token Holding behavior
 |
| Figure 12: Sum of ever sent token amounts from specific senders and the current holdings of the respective receivers for the $TRU ecosystem |
- Receivers of the TrueFi stkTRU token contract still hold 65% of the amount once received by this address.
- Receivers of the TrueFi presale address still hold 10% of the amount once received by this address.
- Receivers of the TrueFi Company Tokens – Unlock Nov 21 address still hold 28% of the amount once received by this address.
- Receivers of the TrueFi Unallocated TRU Incentives address still hold 32% of the amount once received by this address.
- Note that in all these cases except for the TrueFi stkTRU token contract, many tokens get redistributed among TrueFi native addresses and thereby don’t leave the protocol. This can also be examined in detail by looking at the diagrams which are not included in this document: here.
Key Token Issuer Network Analyses
 |  |
 |  |
| Figure 13: Historic $TRU receiver network analyses for the TrueFi stkTRU token contract and the TrueFi Unallocated TRU Incentives Left: The historic cumulative token amounts once received from the sender for the top 5 receivers Right: The historic cumulative token sums of the top 5 receivers of all receivers of the sender | |
- Main $TRU receivers from the TrueFi stkTRU token contract are two unidentified addresses, two TrueFi native proxy addresses, and BlockTower Capital.
- The $TRU receivers from the TrueFi stkTRU Token contract sent most tokens to the staking contract, some to Binance, some to an unidentified address, and to DEXs.
- The $TRU token allocations to the stkTRU Token staking contract follow a logistic function shape with a lot of adoption in the beginning and less deposits at a later stage.
- Main receivers of the TrueFi unallocated TRU incentives are TrueFi native addresses.
- TrueFi unallocated TRU incentives receivers sent most tokens also to TrueFi native addresses and 250m to the Null address (burned). The same can be said about the presale receivers (not shown in Fig. 16)
– Goldfinch
Data Scraping date: 31.05.2023
Total Supply: 114,285,714 $GFI tokens
Address Identification Remarks
Many addresses have been identified as indirect mint recipients. They received tokens from the minting address either directly or indirectly. Those addresses are labeled as “Treasury” wallets in this analysis even though many will probably be used to distribute / vest / reward the supply to different stakeholder groups. The limited scope of this work hindered more in-depth analyses in this regard.
Price
 |
| Figure 14: $GFI price chart |
- Continuous decline since the launch of the token within the bear market in 2022.
- This price action also confirms the low value accrual from the actual product, as outlined in the preliminary token value capture analysis of part 1.
Wallets
 |
| Figure 15: Ever interacted wallets and holder counts for $GFI |
- Holder count 3 days after DEX liquidity deployment: 5k.
- Ever interacted addresses grew continuously
- Avg. ever interacted addresses growth: 43 addresses / day
- Avg. holder growth: 12 addresses / day
- The holder count has dropped since the middle of 2022 and is consistent with the price drop. Note that prices and holder counts do not necessarily correlate with each other.
Token Flows of Aggregated Groups
 |
| Figure 16: Token flows of aggregated groups for $GFI |
- The vast majority of 68% of the current total supply $GFI tokens are held within Goldfinch or Goldfinch team member related wallets. Note that there isn’t a distinction between treasury and team wallets in this analysis. Some of those wallets will probably also be used for vesting to different stakeholder groups.
- The initial staking contract holdings were reduced by 75% since the initial allocation and still hold 8.7% of the total supply.
- The initial diverse $GFI rewards addresses holdings were reduced by 50% since the initial allocation.
- The treasury identified addresses hold 57% of the total supply.
- CEX and DEX related holdings are low in general with around 3% holdings of the total supply.
- These aggregated insights are confirmed by the equivalent Nansen token distribution analyses in Appendix A.4 except for the CEX holdings. Nansen indicates past CEX holdings of ~35% of the total supply, which haven’t been detected in this analysis. Note that Nansen doesn’t show the same data depth that is present in this analysis.
Leaderboards
 | 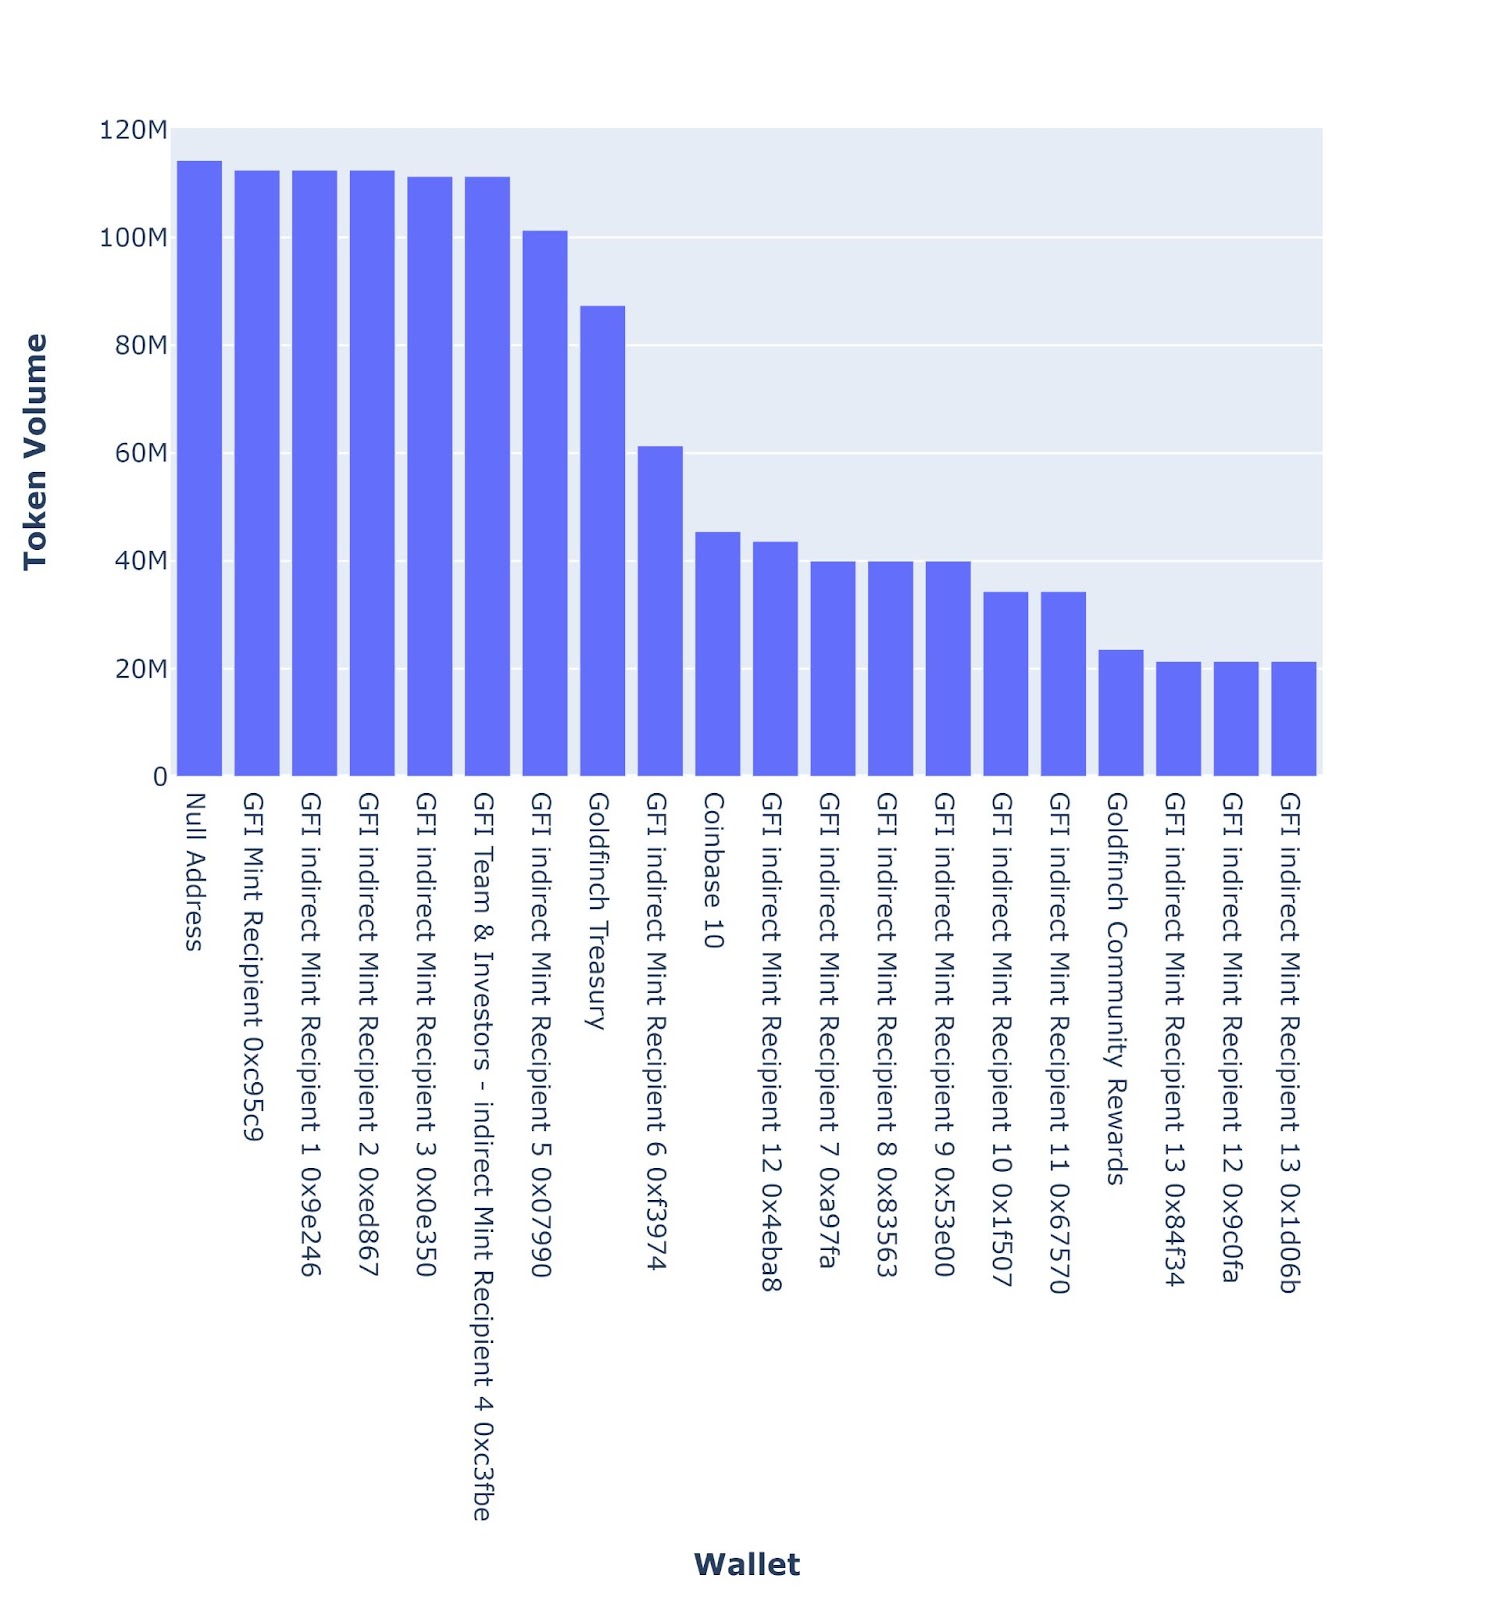 |  |
| Figure 17: $GFI transaction count, volume, and balance wallet leaderboards | ||
- Most transactions happened through the Goldfinch Reward Pool and fourth most through their Community Rewards address.
- Other relevant actors in terms of transaction counts are DEXs, CEXs, and other Goldfinch reward addresses.
- The top 20 highest token volume addresses are all Goldfinch related.
- The direct minter sent tokens to other Goldfinch addresses that in some cases forwarded them to others, which resulted in a network of 24 identified addresses that received indirect tokens by the initial token minter address. Note that only the most relevant addresses are considered in this analysis, therefore more addresses than just the 24 could be involved.
- Almost all top 20 $GFI holders are directly or indirectly Goldfinch related addresses.
Token Holding behavior
 |
| Figure 18: Sum of ever sent token amounts from specific senders and the current holdings of the respective receivers for the $GFI ecosystem |
- Many indirect token mint recipients forwarded a share or all of their tokens.
- Except for two addresses, all identified recipients of the indirect token minter don’t hold any or only a small share of the initially received tokens.
- The receivers of the Goldfinch Backer Rewards address still hold slightly more of the tokens once received by it.
- The receivers of the Goldfinch Community Rewards address still hold 60% of the tokens once received by it.
- The receivers of the Goldfinch Reward Pool address now hold 4% more tokens compared to the tokens once received by it.
Key Token Issuer Network Analyses
 |  |
 |  |
 |  |
| Figure 19: Historic $GFI receiver network analyses for the Goldfinch Backer Rewards, Community Rewards, and Reward Pool Left: The historic cumulative token amounts once received from the sender for the top 5 receivers Right: The historic cumulative token sums of the top 5 receivers of all receivers of the sender | |
- Main receivers of the Goldfinch Backer Rewards, Community Rewards, Reward Pool, and Staking Rewards have been identified as retail or VC addresses.
- Reward receivers sent their tokens primarily to a GFI Deposit Proxy and secondary to exchanges.
- The $GFI token flow from Goldfinch Community Rewards and Reward Pool receivers to the GFI Deposit Proxy looks like a logistic function shape with a lot adoption at the beginning and less deposits at the end
- Since the end of 2022 up to now the token flow from Goldfinch Reward Pool receivers towards the Uniswap V3 GFI-ETH pool has increased. This is in line with the overall price depreciation
Summary and Insights
A token valuation comparison against the crypto market shows that uncollateralized lending protocol native tokens underperformed in general. For the 3 more detailed analyzed protocols Maple, TrueFi, and Goldfinch, huge token price losses of more than 95% from their last bull cycle all-time highs could be observed.
Despite the token price losses, ever interacted addresses and holder addresses increased continuously since liquidity deployment for all 3 considered protocols. Only the Goldfinch token decreased in holder counts since the middle of 2022. Ever interacted address growth rates vary from 18 to 43 addresses per day and holder growth rates vary from 6 to 12 addresses per day. The real growth curves for ever interacted addresses and holders have a linear shape as opposed to often assumed sigmoid shapes. The initial holder count 3 days after DEX liquidity deployment was 1.25k for $MPL, 2k for $TRU, and 5k for $GFI.
Token Interaction Behavior
In all three protocols their native token balances decreased over time. The introduction of the new xMPL staking contract of Maple increased the protocol holdings by around 10% through external senders. However Maples holdings continue to decline from the new plateau ever since and sits now at a lower level than before the staking contract activation. The Goldfinch analysis shows 68% of the total token supply is held by protocol related wallets or contracts, where no specific purpose could have been identified. It is assumed that these wallets are probably reserve wallets for future vesting and community incentives. The share of total supply that is held by exchanges (DEXs and CEXs) varies over time, but ranges from 1.7% (Maple and Goldfinch) to 29% (TrueFi). The aggregated VC fund holdings of the different protocols do not rise over time and indicate a constant selling of their vested tokens. Note that VC investors also deposited half of their holdings to the new xMPL staking contract once it got deployed in the case of Maple, hence a staking adoption by early investors could be observed.
A general observation of token issuance contracts of all protocols, such as staking and community rewards, show that their native token balances decrease over time and that thereby their protocol incentive mechanisms don’t seem to be sustainable over the long term at the time of writing.
In terms of transaction count and token volume rankings, protocol native addresses and exchanges are always the most relevant parties. The current token holding leaderboard is also occupied by protocol related wallets and contracts. These anticipated outcomes are true for all 3 protocols.
The token rewards receiver behavior is diverse. For some rewards issuing protocol contracts their receivers still only hold around 10% of the tokens they once received by them. In other cases they hold up to 4% more tokens than they ever received. This is possible in cases where the receivers received tokens also from other sources, such as buying on the open market. Note that sent tokens haven’t been differentiated with respect to the categories “withdrawals” or “reward payouts”. As this distinguishing couldn’t be made for all protocols due to their contract architecture, it hasn’t been done in the scope of this work.
The final analysis section investigates the exact token receiver behavior in terms of their main receivers. Even though the previous analysis indicates that the majority of tokens will not stay in their respective receiver wallets, it doesn’t necessarily mean that those tokens were sold. They could be sent back to the original sender or transferred to other related wallets. One main observation was the logistic function shape adoption of staking contracts. At the beginning after their deployment many key sender receivers sent tokens to staking contracts, but the slope decreased over time with less deposits at the end. This is in line with the observed declining staking contract balances and could be observed in all 3 cases. The simultaneously increasing CEX holdings in the cases of TrueFi and Goldfinch confirm that there is a constant token sell-off, which could likewise be observed in the respective token price charts.
Fig. 20 summarizes the behavior of the token receivers of staking, vesting, and rewards addresses. The ordinate shows the token volume share compared to the overall tokens that have been sent as the first transaction after a receiver received tokens for the first time by a sender (staking, vesting, or rewards). It shows where receivers of key senders sent their tokens first. In the case of Maple staking contract receivers, 38% of the tokens have been sent back to the staking contract, 8% have been sent to CEXs, and 14% have been sent to DEXs after receivers received the first time tokens from the staking contract. In the case of Maple vesting, 25% of the first transaction token volume went to the staking contract and 29% went to a DEX. This indicates that original staking participants are more likely to reinvest their tokens than vesting receivers, which tend to sell their tokens instead of staking considering the above described context and data. Note that the percentage doesn’t sum up to 100% as receivers could have sent their tokens also to other buckets or network stakeholder addresses, which don’t fit into the considered stakeholder categories.
 |
| Figure 20: Token volume share of the first transaction to ecosystem buckets after receivers received tokens from key stakeholders |
The following table summarizes some more key metrics. Note that they are only valid under the assumptions and limitations made and for their respective time snapshots documented in this report.
| Parameter | $MPL | $TRU | $GFI |
| Total Token Supply / m | 10 | 1,198 | 114 |
| Holder count after 3 days of liq. deployment / k | 1.25 | 2 | 5 |
| Avg. wallet interaction growth / addr./day | 18 | 26 | 43 |
| Avg. holder growth / addr./day | 6.8 | 8.1 | 12 |
| CEX supply holding / % | 1.7 | 29 | 2.4 |
| DEX supply holding / % | 1.4 | 0.8 | 0.2 |
| Protocol native address supply holding / % | 42 | 35 | 68 |
| Staking contract supply holding / % | 19 | 10 | 8.7 |
| Treasury supply holding / % | 19 | 9.3 | 57 |
| New staking contract adoption | Logistic Function Shape | ||
Outlier Ventures – a strong partner for your Web3 business
Outlier Ventures (OV) empowers crypto start-ups to become successful through holistic expert advisory, networking, and fundraising. Their token economies department provides guidance for NFTs, token design, and token engineering. It leverages powerful tools, such as token design workshops and quantitative token models, to forecast the business idea of Web3 teams or to review and finalize their own token design and model. Applications for OVs’ Base Camp Accelerator for brand new start-up teams or our Ascent program for advanced teams are open. Visit our website for more information: https://outlierventures.io/.
Acknowledgement
I would like to thank Dimitrios Chatzianagnostou for his decision support and valuable feedback throughout the process of creating the content of this case study. Also, thanks to Robert Mullins and Karim Halabi for taking the time to review and provide feedback on a draft version of it.
Appendix
A.1 $MPL Token Distribution Analysis via Nansen
 |
| Figure A1: $MPL token distribution analysis via Nansen from the 30th May 2023 |
A.2 $TRU Token Distribution Analysis via Nansen
 |
| Figure A2: $TRU token distribution analysis via Nansen from the 30th May 2023 |
A.3 $GFI Token Distribution Analysis via Nansen
 |
| Figure A3: $GFI token distribution analysis via Nansen from the 31st May 2023 |
Third Party Dashboards
These are some relevant data dashboards, which are freely accessible through third party providers for potential further analyses.