By Robert Osborne | X | LinkedIn | Eunika Sot | X | LinkedIn
Apps vs Infra…or Infra vs Apps
Everything you know about Web3 fundraising is probably wrong. The ongoing tug-of-war between infrastructure and consumer-facing projects has become one of the industry’s longest-running narratives. The prevailing sentiment, as suggested by the X post from Claire Kart, CMO at Aztec Network, is that infrastructure projects are disproportionately advantaged in the Web3 industry.
But things are never quite as they seem. What if everything we thought we knew about venture capital preference was wrong? What if, in fact, consumer projects have had the unequal advantage?
Web3 Fundraising: Defining the Problem
Specifically regarding venture capital, there is a clear perception in our industry that infrastructure projects get all the attention from investors. ‘Infrastructure’ is imagined to have held the venture capital market captive as consumer projects are left strapped for cash.
In any debate, we start with definitions. Perhaps some of the confusion and friction on either side of the aisle of this battle is caused by conflating terms and blurring the boundaries around what types of projects should be categorised as ‘consumer’ vs ‘infrastructure’. Here are our definitions for the two opposing camps.
Consumer-facing projects are designed to directly interact with end users, offering tools, services, or platforms that cater to individual or retail needs. These projects often focus on enhancing user experience, providing financial services, facilitating entertainment, and fostering community engagement. The end-user is the primary consumer. These solutions are generally more accessible, prioritising usability and immediate value to individuals or businesses with minimal technical expertise.
Infrastructure projects form the backbone of decentralised systems, focusing on the foundational layers that enable secure, scalable, and interoperable networks. These projects emphasise building core technologies such as blockchain protocols, validation systems, and cross-chain interoperability, enabling other applications and services to function. Deep infrastructure includes the technical frameworks that support the decentralised ecosystem, often invisible to the end-user but critical to the system’s overall performance and reliability. They cater primarily to developers, node operators, and those responsible for the maintenance and scalability of blockchain systems.
Now let us apply these definitions to industry project categories. Here, there is no need to reinvent the wheel. Rather, we will use the categories embedded in fundraising data of our friends at Messari.
Categories under the consumer app umbrella include: Consultancy and Advisory; Cryptocurrency; Data; Entertainment; Financial Services; Governance; HR and Community Tools; Investment Management; Marketplaces; Metaverse and Gaming; News and Information; Security; Synthetic Assets; and Wallets.
Project categories considered under infrastructure include: Networking and Web Services; Node Tooling; Cross-Chain Interoperability; Networks; Physical Infrastructure Networks; Compute Networks; Mining and Validation; Developer Tooling; and Consumer Infrastructure.
As a short aside, the category of ‘consumer infrastructure’ is the perfect example of blurred boundaries. It’s the scaffolding that supports user-facing applications without always being visible to the user. For our purposes, ‘consumer infrastructure’ will be treated as infrastructure.
Drawing a Line in the Sand
Why does this debate matter? Why have founders and investors felt the need to draw a line in the sand on this subject? Not long ago Boccaccio, from Blockworks, Mike Dudas, 6th Man Ventures, and Haseeb Qureshi, Dragonfly, shared a panel together at DAS New York 2025 briefly discussed this matter.

A riveting debate, but four words between two people won’t settle the matter.
Infrastructure proponents see themselves as the (not-so-)incognito architects of the onchain future, laying down the digital railroads before letting consumers speed ahead. Without robust scalability capable of handling traffic surges and airtight security to safeguard against hacks and exploits, widespread adoption will remain a pipe dream. As Haseeb Qureshi put it in the panel discussion, “Are we done building blockchains? Is this the final form? If we want more than 10 million people to be using public blockchains, we’re not done.”
By investing capital into technical research and development, the goal is to streamline the building process, reduce friction for the next wave of dApp creators, and ultimately make interacting with blockchains ubiquitous. This isn’t a fleeting bet but a long-term play: build the infrastructure and this will enable the smooth delivery of killer consumer dApps.
The critique from the other side is that the system is rigged in favour of infrastructure projects to the extent that even the most successful consumer applications are considering a shift to infrastructure plays: Uniswap is building modular AMM rails, Coinbase launched its own L2, and even social apps like Farcaster now pitch themselves as social protocols.
To paraphrase a comment from Mike Dudas on the panel, the current structure of the market means that infrastructure projects by default are treated as the favourite child by venture capital firms, despite the fact that there is not actually that much liquidity at play in these projects.
In this way, consumer project advocates see the role of venture capital as a contrived market distortion: if only more capital could be allocated to consumer apps, then mass adoption would be achieved. Clunky wallets and impenetrable interfaces form the biggest barriers to onboarding, rendering the most powerful blockchains all but invisible to the masses. What really moves the needle are “killer apps.” The desire for high-speed and secure infrastructure rails are all well and good, but if the seating is uncomfortable and the journey experience is poor, then no one is going to buy a ticket.
What these debates often take for granted is that infrastructure projects do indeed get a disproportionate amount of the capital fundraised. This assumption is made as our industry is still considered to be in its infancy. Until the underlying rails are solidified and widely adopted, it’s natural to see an outsized focus on infrastructure relative to consumer apps.
Looking at the early development of the Web3 venture capital market, however, we found that there was a preference for consumer projects over infrastructure from the get-go (see Figure 7).
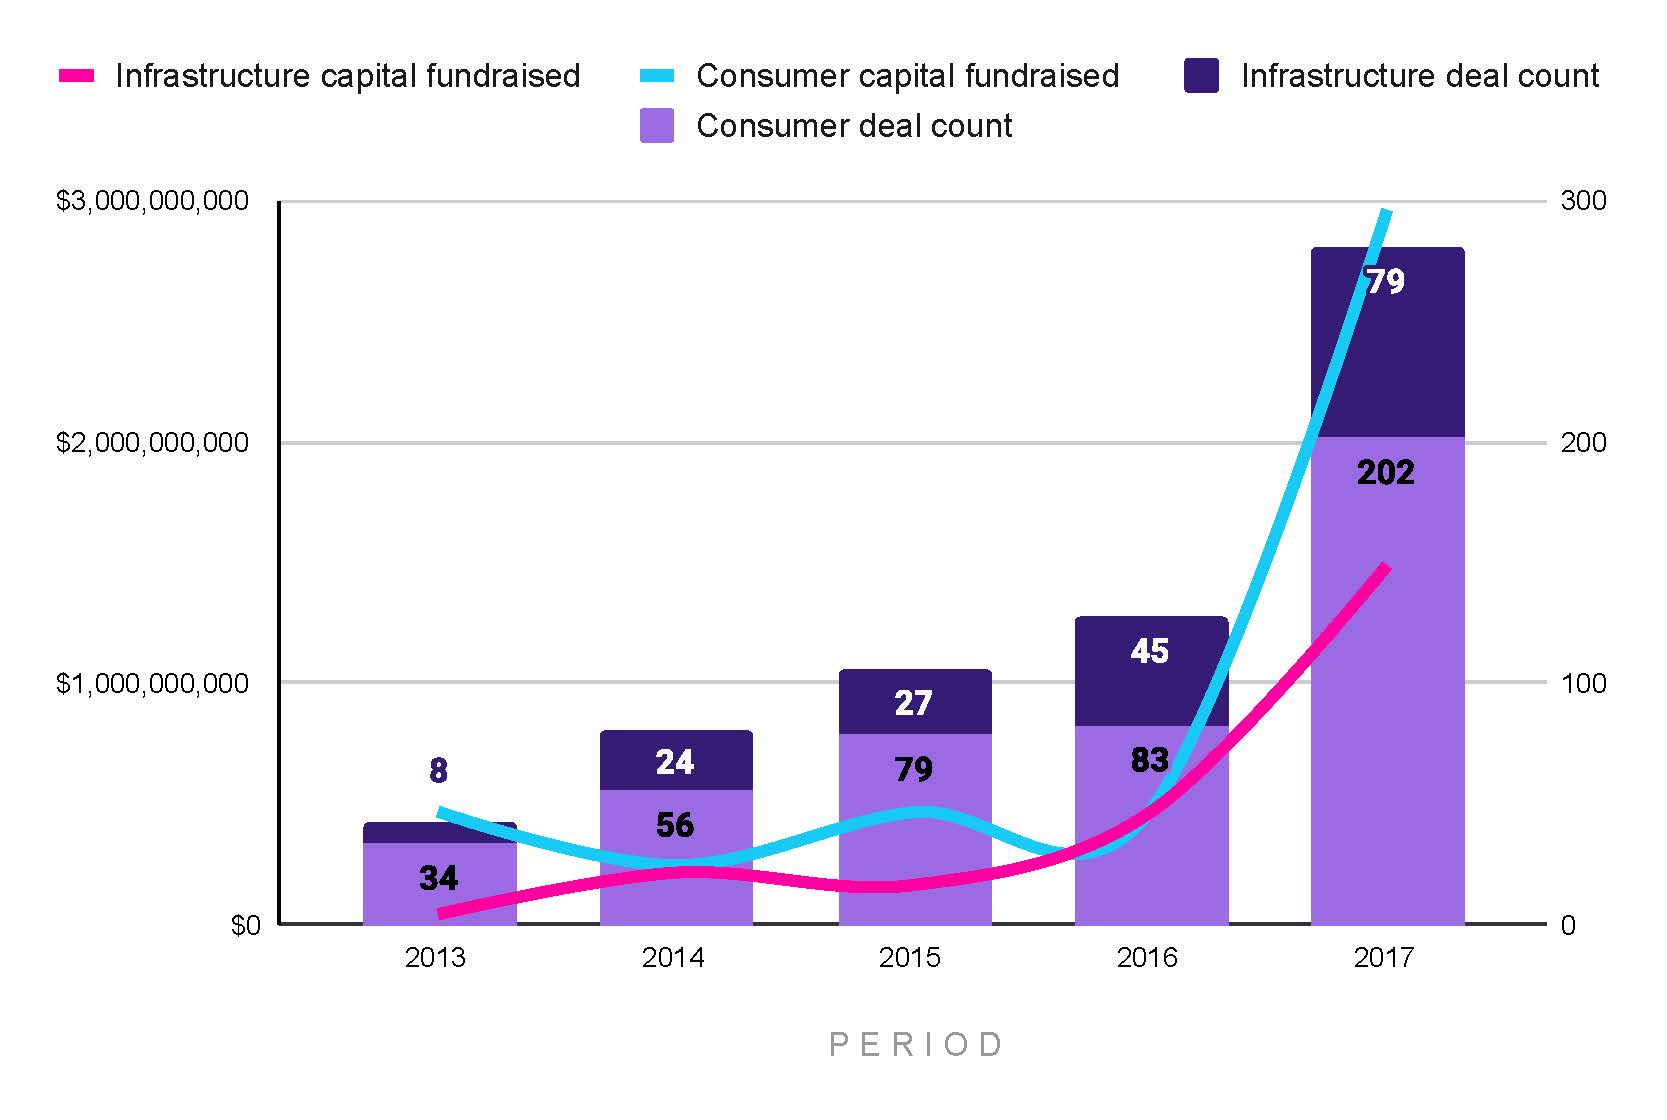
Given the availability of data on this subject, we will use 2013 as a starting point. What we observe is that from 2013 to 2017, 72% of the total fundraising deals were closed by consumer projects and 33% of the total capital fundraised went to infrastructure projects. In 2014 and 2016, the two categories did reach parity in total capital fundraised. In these two years, there were still more consumer projects that successfully fundraised and we can infer that infrastructure projects did achieve much larger round sizes. Although, as we will see later, this is fairly typical (see Figure 12). In 2017, we observe that consumer projects return to capturing the larger share of the Web3 venture capital market.
Relative to all the capital and number of deals that came after the period illustrated in this chart, we can hardly consider this to be where the backbone of the Web3 ecosystem was built and funded. It is also for this reason that this chart has been separated from the main argument below because the availability of data is relatively low. Placing the above data alongside the period from 2018 to 2024 would demonstrate that very early venture capital interest was a drop in the ocean compared to the deluge of capital that would follow.
Although sparse, this data does enough to plant the seed of doubt at the very heart of its debate. Is it even true that infrastructure projects receive more funding than their consumer counterparts? Is everything you know wrong?
Does Venture Capital Have Consumer Bias?
Looking at Web3 fundraising data from 2018 to 2024, we found that only relatively recently infrastructure projects have benefited from extra attention, and that it is founders building consumer apps that have been spoiled for investment.

Consumer apps represent 74% of the total number of fundraises from 2018 to 2024 across all stages. This hasn’t actually changed too much in recent quarters. Looking at 2023 and 2024, consumer apps still accounted for 68% of the total fundraises across all stages (see Figure 8).
The story for total capital fundraised, however, shows a change of fortune for infrastructure projects. From 2018 to 2020, infrastructure projects were left behind and consumer apps were king: only 11% of all capital fundraised from 2018 to 2020 went to infrastructure projects. In 2021, this began to shift despite the fact that consumer projects still accounted for the majority of total fundraises. Infrastructure projects represented 19% of capital fundraised in 2021 and 2022, 25% in 2023 and 43% in 2024 (see Figure 9). In fact, from 4Q23 to 2Q24 infrastructure projects overtook consumer projects in total capital fundraised.

Another data point to examine is the number of investors participating in Web3 fundraises across the two categories. In the aforementioned panel discussion at DAS New York 2025, Mike Dudas commented that most investors default to infrastructure investment. But if we stick to our definitions, we can begin to doubt Dudas.
As a simple illustration, we can count the number of investor deals involved in consumer vs infrastructure fundraises from 2018 to 2024. It should be noted that we’re not counting the number of unique investors but rather the number of investors included in each fundraise. One investor may be counted more than once if they have invested in more than one fundraise, whether that is in a consumer or infrastructure project. One investor participating in three fundraises is counted as three investor deals.
Lo and behold! It is not the case that there has been a relative sparsity of investors interested in consumer projects: there has been consistently a greater number of investors putting capital into consumer projects in the measured time period. The greatest gap in the number of investors between infrastructure and consumer projects was between 2021 and 2022: 79% of the total number of investor deals were in consumer projects (see Figure 10).

Whilst the scaled up investment in consumer projects did not occur until two quarters after the first lockdown restrictions were enforced in March 2020, this is exactly to be expected as it is typical for the fundraising process to take six to nine months to complete. Web3 investors made a bet: as ordinary consumption was otherwise restricted during the pandemic lockdowns, people’s attention and disposable income would be spent more online, and ideally onchain. As it became clear that global lockdown restrictions would continue, more and more investors became interested in the consumer craze.
This was unsustainable, however.
The conventional answer for the crypto market crash in 2Q22 points to the Terra/Luna collapse in May of that year as the critical inflection point that set off a chain reaction. When Terra’s algorithmic stablecoin UST lost its peg, over $40 billion in value was wiped out almost overnight, exposing the fragility of many DeFi systems and shattering investor confidence. The fallout revealed how deeply interconnected the crypto ecosystem had become, as major funds and lenders like Three Arrows Capital and Celsius unraveled in rapid succession. This contagion effect set off a credit crisis in crypto, while broader macroeconomic forces — including rising interest rates, surging inflation, and tightening liquidity — added pressure from outside. All of this came on the heels of an overheated bull market fuelled by speculative excess, unsustainable yields, and inflated valuations. This was then further compounded by the bankruptcy of FTX in November 2022.
From a venture capital perspective, however, there is an additional layer to consider. As the crypto markets rallied at the end of 2023 and then again in 2024 – alongside the bullish real activity with memecoins – the same level of enthusiasm did not extend to the venture capital market. That is because we are still living in the hangover of the Covid consumer craze. This is a delayed recession following the failed or underwhelming venture yields that were incurred during the period from 4Q20 to 4Q23. This has exposed the prematurity of consumer app investment and the immaturity of crypto VCs. Whilst there have still been more investor deals for consumer projects following this period, the consumer-infrastructure gap has significantly narrowed. For example, in 2024 infrastructure projects represented 40% of total investor deals.
This is not unique to Web3 venture capital. Billions of dollars flooded the traditional VC market from 2020 to 2021. “@carrynointerest”, a private equity investor argued in an X thread that there will be a long tail of VC failures resulting from the misallocation of capital during that period. A lack of M&A exits, combined with rising interest rates and collapsing software acquisition multiples, has left many VC-backed companies stranded, the so-called “orphaned” or “zombie” startups.
By superimposing the total capital raised in the Web3 venture market against the backdrop of the number of unicorns recorded in the traditional VC market, we see a very similar shape and trajectory reveal itself (see Figure 11). As we have already demonstrated (see Figures 8, 9 and 10; see also Figure 12 below), much of capital share and deal share was allocated to consumer projects. In a Web3 context, the failure of the venture market has been the failure of consumer projects. For the VC asset class, this should be existential, and with this understanding, it makes sense that there ought to be a shift by investors towards infrastructure.

The market correction away from consumer capital allocation, however, has been weak.
The reason for this perhaps lies in the structure of Web3 fundraising itself. Unlike traditional equity, token-based investment allows for earlier liquidity (in many cases, even before the product exists). This means investors can exit with partial ROI even from projects that ultimately fail.
Furthermore, Web3 infrastructure projects generally have longer vesting and cliff periods for token unlocks because they have longer development periods and rely on careful tokenomic design. Infrastructure projects often involve low-level protocol engineering, security considerations, and ecosystem development, which means both founders and investors are incentivised to align around long-term value creation rather than short-term liquidity. Their tokens also tend to play a critical role in network operations (e.g. staking or governance) making sudden unlocks potentially destabilizing. By contrast, consumer-facing projects are more likely to prioritize speed to market, user growth, and early liquidity, which often results in shorter vesting schedules and quicker unlocks designed to take advantage of hype cycles and speculative demand.
The result is a kind of reflexive capital recycling: early liquidity from one consumer project feeds the next, propping up ongoing investment in the category and muting the effects of failure. In this way, the Web3 venture market has insulated itself from the harsher consequences that have hit traditional VC.
As an additional metric, we can combine the total capital fundraised and the total number of deals to generate a median round size (across all stages) for consumer and infrastructure categories. Furthermore, we can map this against the total number of investor deals to demonstrate the journey of each category within venture capital (see Figure 12).

2018 to 2020 saw consumer projects dominate the Web3 venture capital market. In 2021, both consumer and infrastructure categories reached relative parity in median round size ($14.8m for consumer projects, $14.2m for infrastructure), but consumer projects maintained four times the number of investor deals. 2022 saw larger median infrastructure rounds for the first time ($13m vs $11m median consumer round sizes) and this continued in the following years. Only by 2024 does infrastructure appear to be in a stronger position than its consumer counterpart: the median round size for infrastructure projects across all stages was twice that of the consumer category.
But the venture capital adjustment towards infrastructure is not a full reversal of previous market trends. The consumer category has consistently seen more investor deals each year. In 2024, the consumer category still had 50% more investor deals than the infrastructure category. Therefore, whilst VCs may be deploying relatively less capital, they’re still very much interested in investing in consumer projects. It is a testament to the variety of projects under the consumer category umbrella that it still attracts a considerable amount of investor attention (see Figures 9 and 10).
The Venture Preference Index
By combining capital share, deal count share and investor share, we created a score for describing the venture capital preference for either consumer or infrastructure projects over time: The Venture Preference Index (see Figure 13).
The score ranges from 0 to 1, wherein 0.5 is neutral. The scores are mirror images of one another, so if one score is 0.25, the other will be 0.75. As the infrastructure score rises towards the midway line, this is a signal that infrastructure deals are gaining traction in the venture capital market. Correspondingly, as the consumer score trends towards 0.5, this is an indication consumer projects are losing the relative interest of investors. As of yet, there has been no inversion point wherein infrastructure projects score more highly than consumer projects as a venture preference. The closest it has got to was in 1Q24, when the infrastructure score reached 0.48. In essence, the index acts as a barometer of where venture conviction lies.

It should also be noted that the underlying components of the score calculation are weighted. Capital share 50%; deal count 30%; and investor share: 20%. The capital share is the strongest signal of conviction. Big rounds usually follow deep diligence and imply greater belief in potential returns. It also reflects the aggregate market’s dollar-weighted priorities, which is useful for understanding which sectors VCs are betting on most heavily. The deal volume signals breadth of interest. A high deal count shows that many teams are building and, relative to the capital deployed, VCs are placing smaller bets. But deal size can vary wildly, and not all deals reflect strong conviction as some may be exploratory or FOMO-driven.
Investor participation – or number of investor deals – helps show crowdedness or diversity of interest, but it’s a noisier metric. Some investors are passive, and multiple investors in a round doesn’t necessarily mean strong or deep interest, especially in more bullish markets. Still, it adds nuance, especially when investor counts are high in one category despite lower capital allocation.
As seen through the data above and the index created, the consumer category has remained on top. But all of this begs the question; what is the ‘correct’ ratio? Is that even a valid question to ask? Should we expect the VC preference score for infrastructure to exceed 0.5 (and for the consumer score to thereby fall below 0.5)?
Let’s Rethink Capital Allocation in Web3
There is no objectively correct ratio because the relationship between infrastructure and consumer projects is cyclical, context-dependent, and reflexive. But different ratios signal different phases of market maturity.
In emerging tech ecosystems like Web3, it’s natural for infrastructure to attract outsized capital in the early phases. Foundational layers take longer to build, require more technical depth, and often involve “winner-take-most” dynamics that justify large, concentrated bets. Infrastructure unlocks scale, performance, and security: all prerequisites for meaningful consumer adoption. In that context, a venture capital tilt toward infrastructure would seem not just rational, but necessary.
Yet the data tells a different story. Venture capital has consistently favoured consumer-facing projects. What we see is a market that behaves as though the infrastructure problem is already solved or, at least, solved for now.
This disconnect raises important questions. Has the industry prematurely shifted attention toward consumer apps without fully stress-testing the foundations beneath them? Are we misallocating capital in ways that prioritise short-term liquidity over long-term robustness? Or are we underestimating just how much infrastructure is already in place and failing instead to focus on the user experience layer that will drive mass adoption?
These aren’t binary choices and there is no perpetually ‘correct’ ratio for consumer vs infrastructure investment. Web3 will need both scalable infrastructure and compelling applications to succeed. But timing matters. Capital allocation should reflect where the ecosystem truly is on the maturity curve, not where we wish it were. The path forward isn’t about favouring one side over the other, but about recalibrating conviction to reality.
This Is Just the Beginning
We’ve only scratched the surface. This blog is the first in a series of content diving deep into Web3 fundraising trends — drawing from our unique vantage point as one of the longest-running accelerators in the space. Over the coming weeks, we’ll be unpacking more surprising insights and releasing our full report. Spoiler alert: everything you know about Web3 fundraising is wrong.
Subscribe to our newsletter to get early access to upcoming articles, data drops, and the full report when it goes live.