Blog written by Matthis Herbrecht & Achim Struve from our Token team.
Recommendations for Ecosystem Incentives Campaigns:
- Implement multi-phase airdrop strategies: Follow Optimism’s model of multiple airdrop seasons to maintain user engagement over time. This approach helps retain users beyond the initial distribution and encourages long-term participation in the ecosystem.
- Allocate significant resources to grant programs. Dedicate part of your incentive budget to grants for developers and builders. This mid-term approach helps establish a strong Dapp ecosystem, essential for user retention and sustainable growth. Then, implement a robust monitoring system to track key metrics and analyze the impact of incentives. This will enable data-driven adjustments and continuous optimization of the grant program.
- Focus on reducing cost per user over time: Aim to reduce the cost per monthly active user (MAU) as your network matures. Optimism’s approach of combining recurring grants with strategic airdrops has resulted in a relatively low cost of $304 per MAU.
- Prioritize ecosystem development before token launch: Consider Base’s approach, which focuses on culture, builders onboarding and ecosystem development without having a token. Allocate resources to small, targeted grants for founders and projects that align with your ecosystem’s vision, rather than relying solely on token incentives.
- Balance short-term and long-term incentives: Aim for a split between short-term incentives (like airdrops) and long-term incentives (like grants and ecosystem funding). This balance helps in both attracting initial users and sustaining long-term growth.
- Implement user retention strategies beyond financial incentives: Develop a strong community culture, focus on smooth developer onboarding, create engaging experiences and events, improve the user experience similar to Base’s approach. This can help maintain user engagement even without constant financial incentives.
Setting the Stage: Understanding L2 Incentives
Layer 2 (L2) networks have emerged as key solutions to blockchain scalability challenges. As these networks compete for market share, incentive programs (particularly grants and airdrops) have become a key factor in their growth strategies. Given the significant resources invested, we wanted to take a step back and examine their effectiveness through this analysis.
Scope of this study
The focus here is on two primary incentive mechanisms:
- Grants
- Airdrops
This analysis excludes application-level incentives such as liquidity mining or yield strategies to maintain a clear focus on L2 blockchains. We took the data from 2021 to September 2024.
Key Performance Indicators
We considered two main metrics to evaluate the performance of the incentive program:
- Revenue Generation: Ideally, this revenue growth should at least partially offset incentive program costs, demonstrating a positive return on investment and would indicate a successful program.
- User Acquisition + Retention: Achieve sustainable, short/mid-term user growth on the chain at the lowest possible cost. Therefore, we will track the evolution of Monthly Active Users (MAUs).
Revenue generation and user acquisition are closely tied. More MAUs lead to increased network activity and transactions, boosting sequencer revenue. Higher revenues suggest a valuable network, attracting and retaining users, which increase revenues. This positive feedback loop is crucial for long-term success.
By tracking these numbers closely, we get a clear picture of each chain’s incentives campaign and its impact on these two metrics.
Before Diving in: Context and Limitations
Like any deep dive into complex data, it’s important to keep in mind certain limitations:
- Layer 2 lacks a clear incentives dashboard that details all grants, including dates and exact token amounts. Each ecosystem also views airdrops and grants differently. For example, some ecosystems consider private investments in tokens or equity as grants. However, we do not classify these as grants in our study. The lack of transparency and multiple definitions of grants and airdrops highlight the difficulty in collecting this data.
- The Optimism superchain and ZK stack are not considered, only the main chain is taken into account. Base received grants from Optimism which is not taken into account.
- The definition of what is a grant and what is an airdrop might overlap, especially in the case of Optimism.
- Incentives influence other metrics such as protocol TVL or number of applications but we chose to focus on MAU and chain revenues as our primary metrics for evaluating Layer 2 incentive programs. These metrics were selected because they are easy to quantify and the data is easily available from public sources. While MAU and chain revenues are correlated, they offer valuable insights into both the short-term and long-term impacts of incentives. Finally, It’s better to stick to 2 or 3 metrics to keep the analysis digestible.
- While our considered metrics MAU and revenues are closely correlated other factors also play crucial roles. Community culture, narratives, marketing, technological progress, and macroeconomic conditions significantly influence outcomes. However, this case study is a simplified approach, where the effect of incentives is examined in a more isolated manner.
- Incentive costs are calculated based on the dollar value of tokens at their distribution date.
- Data on recent L2s such as Starknet, Blast or Zksync era is very recent and it’s always difficult to draw conclusions on the short term.
With the context set, let’s dive into the analysis.
Incentive Impact on MAU (Monthly Active Users)
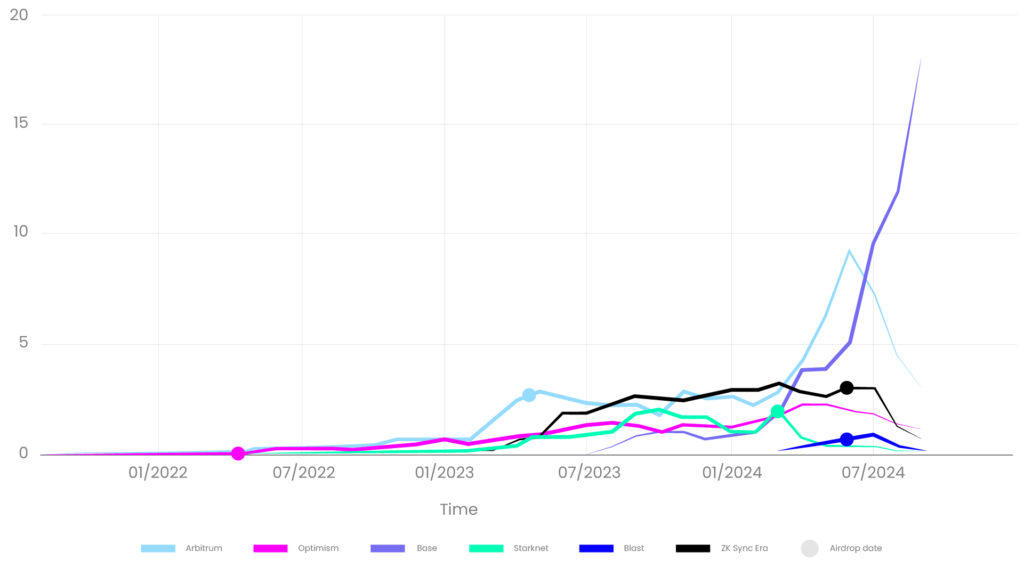
Let’s start with a simple graph that references the number of monthly active users for each considered L2.

The graph shows:
- Base is the only chain that consistently grows by an average of 56% in monthly active users, with a strong retention ratio without any significant declines, unlike other chains that have seen a decrease of their user base in recent months.
- Every other L2 has experienced a drop in their user base over the last few months.
- Monthly active users have decreased after the airdrop event for latest chains like Zksync era, Blast, and Starknet, while they slightly increased for first-mover Layer 2 solutions such as Optimism and Arbitrum.
We see four main reasons for that:
- Recently, we’ve seen an increasing number of L2 solutions going live. As a result, users become diluted between those L2s and their respective airdrop campaigns. This trend may explain why new Layer 2s struggle to retain users post-airdrop.
- Another explanation could be the grants offered by Arbitrum and Optimism, which serve as effective long-term user retention strategies. The upward trend in the graph following their airdrops shows these projects successfully maintain user engagement, unlike newer Layer 2 solutions that struggle to keep their user base. Based on that, we can make the assumption that it is due to a lack of grant incentives and/or a small ecosystem with few applications.
- As chains become more and more mature, culture is what differentiates L2s. Optimism, Arbitrum, and Base might have an advantage in this area as they are older. The same goes for the security/decentralization stage, as two of these chains (Arbitrum and Optimism) are at stage 1 according to “L2beat”.
- Base doesn’t have a token. People are (i) expecting an airdrop and stay there because it’s one of the last big L2s to not have a token, (ii) enjoying the culture and activity there, and (iii) trusting Base because Coinbase is behind it.
However, MAUs aren’t the only metric to consider. Let’s also examine the impact of the incentives campaign on revenue.
Incentives Impact on Revenues
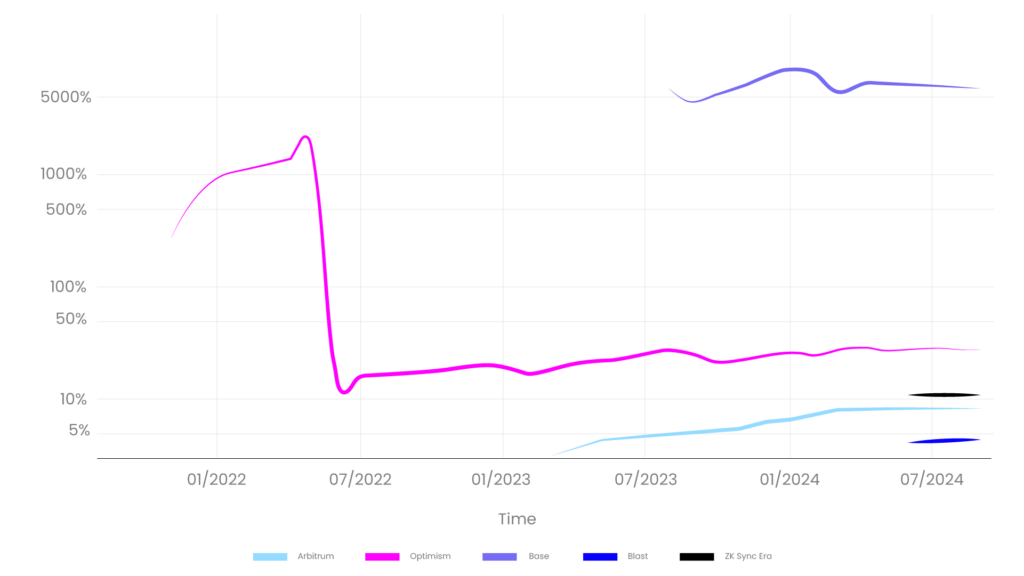
Now, let’s examine the second metric discussed in this article, which is revenue. To analyze this second metric, we reviewed the total incentives distributed (in dollars) and compared them with the total revenues generated by the chain (in dollars).
Since chains often launch incentive campaigns immediately after the chain goes live on mainnet, it’s not possible to compare scenarios with and without these campaigns. We decided to divide each L2’s cumulative revenue by its cumulative incentives to obtain comprehensive data.

Several points emerge from this analysis:
- Two chains earned more money than they spent on incentives:
- Base is doing extremely well, with low incentives and high activity leading to high revenues. For every dollar spent on incentives, they generate around 50$ of revenues.
- Optimism was also net positive before the first airdrop via grants.
- With airdrops, chains generate fewer revenues than spending through incentives.
- For every $100 spent on incentives, Blast, Arbitrum, Zksync, and Optimism generate $5, $8, $11, and $27 in revenue, respectively.
- It’s important to note that Optimism and Arbitrum, which are among the chains providing the largest grants over time, are experiencing a growing number of monthly active users. In contrast, others remain flat, with nearly no grant campaigns yet.
We can conclude two things:
- In the short term, airdrops prevent every L2 from being net positive (earning more revenues in dollars than incentives they’ve spent).
- Based on the existing data, older chains that actively and frequently offered grants to builders tend to reduce incentive costs per user over time.
Incentive Costs per User
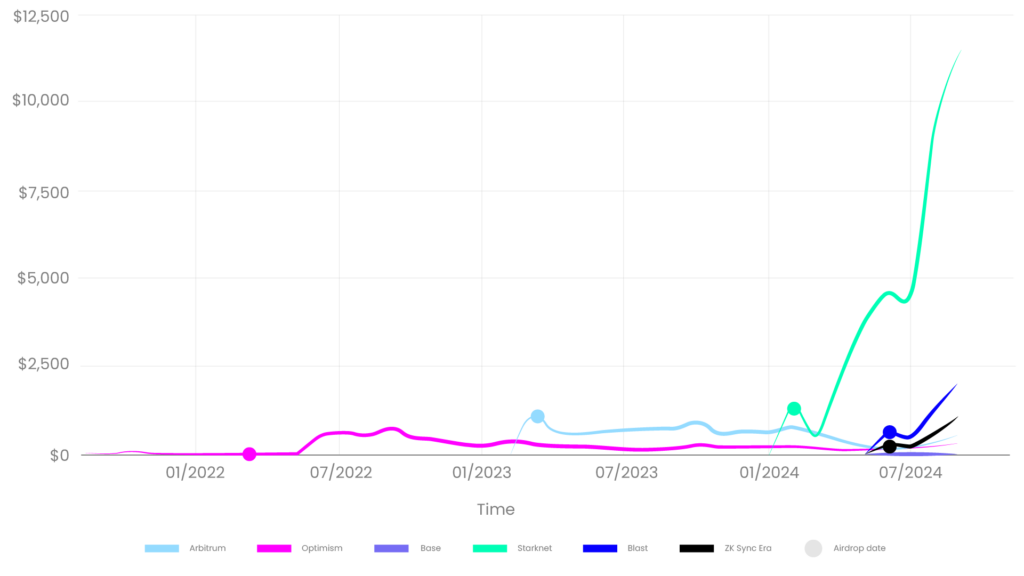
The following graph illustrates the total cost per user for each L2 chain and reveals three main patterns.

- For first-mover L2s such as Arbitrum and Optimism, there’s a noticeable spike in the cost per user due to airdrops. This cost decreases drastically as fewer incentives, such as airdrops or grants are emitted over time, while more users join the network thanks to the impact of these incentives. Arbitrum and Optimism effectively manage their costs per user, maintaining a stable level of $560 for Arbitrum and $304 for Optimism (latest value). Their strategies include recurrent grants and, in Optimism’s case, airdrop seasons that maximize user retention and maintain a steady user base that goes beyond just farming airdrops. This success is also due to a strong ecosystem and many dApps (Gmx, Aave, Velodrome…) that keep users engaged over time.
- A second pattern is an initial spike in incentive costs due to airdrops that is followed by a continued increase not because of additional incentives but due to a rapid decrease in monthly active users. This happens because users engage in “farming” activities until airdrops are distributed, then leave the chain and resulting in fewer users and higher costs per user, such as shown in Fig. 3. Zksync, Starknet, and Blast experienced significantly higher costs — at $1,102, $11,486, and $2,000 per user, respectively — due to high valuations at token generation events (TGE) and a rapid user exit post-airdrop.
- Meanwhile, Base stands out with a remarkably low cost of less than 10 cents per user. This efficiency stems from two key factors: Base has not distributed its own token, and the chain has attracted a substantial user base.
- Base has not officially announced any airdrops. They do have incentives, such as allocating over one million dollars in grants to builders using ETH or stablecoins, but this is minimal compared to other chains. To give you an idea, that’s 362 times less than the total number of incentives emitted by blast, or 633 times less than Zksync era. Even without considering the airdrop and focusing solely on grants, it’s still 100 times less than Optimism grants.
On average, across six analyzed chains, the cost is approximately $2,577 per MAU.
Key Insights
- Airdrops primarily reward users who interacted with the platform before the event, stress-test the network, and generate revenue. In contrast, grants aim to bootstrap a protocol, retain users over the long term, create a culture and build a flywheel ecosystem (token gravity).
- Across all incentives, more than 90% consist of airdrops, while the rest are grant campaigns targeting developers and builders in the long term.
- Most Layer 2s are not net positive, as their expenses exceed their income, mainly due to the huge airdrop distributed at high token launch valuations.
- Incentive goals are not to generate more profit than what they spent.
- Base is the only L2 that generates more revenue than it spends on incentives, thanks to many factors:
- Smooth developer onboarding
- Culture
- Airdrop speculation
- Coinbase reputation
- Competitive transaction fees
- Older L2s tend to have lower costs per user thanks to:
- Historical security (time tested, multiple audits…)
- Network effects: Recurring grant programs boost the network effects of these L2s. They attract builders and apps over time and thereby cultivate a unique community around the L2, creating a self-sustaining cycle of innovation and growth.
- Base is a unique and isolated case. They focus on providing retroactive and relatively small grants to founders, prioritizing culture over incentive campaigns.
- Except for Base, Optimism is the L2 with the currently lowest cost per monthly active user at $304. This can be explained by multiple airdrop seasons, which help retain users and builders’ grants that bootstrap use cases on the chain.
Acknowledgement
Thanks to Raffaele Geneletti and Dimitrios Chatzianagnostou for their contributions and feedback on this article.
Sources
- https://x.com/0xpedro_eth/status/1788944386757132348
- https://x.com/ThorHartvigsen/status/1712760348850176029
- https://optimism.grant3.co/
- https://community.optimism.io/op-token/airdrops/airdrop-1
- https://retrofunding.optimism.io/
- https://app.intotheblock.com/perspectives/arbitrum_incentives
- https://docs.google.com/spreadsheets/d/1gBzO34v_YRQnR9ABTXjtTHMbqDylDGa54DT7LPekuqI/edit?gid=0#gid=0
- https://assets.blast.io/en/q2-2024.pdf
- https://tokenterminal.com/terminal
- https://www.starknet.io/blog/gaming-committee-launch-advancing-starknets-gaming-ecosystem/
- https://www.starknet.io/blog/starknet-foundation-launches-the-propulsion-pilot-program/
- https://www.starknet.io/blog/starknet-foundation-introduces-the-start-of-defi-spring/
- https://x.com/base/status/1688634181319057408
- https://docs.zknation.io/zk-token/zk-airdrop
- https://www.starknet.io/blog/starknet-provisions-program/
- https://medium.com/@ekojaweephraim/retroactive-public-goods-funding-retro-pgf-3-e3396f2eeec2
- https://www.openblocklabs.com/research/arbitrum-ltipp-efficacy-analysis
- https://x.com/openblocklabs/status/1848567090036543614


